The Toronto Star has an excellent interactive time series of maps showing the different countries and regions of the world from which people immigrated to Toronto from before 1941 to 2005, based on Census of Canada data. Here I have clipped what I think are some key maps from the video sequence that illustrate the broad patterns of immigration both by region of origin and by areas of settlement in the region. Because they are screen captures the sliders and other interactive features do not work, but I think this static version allows the patterns to stand out. I have also added a few comments and a couple of other related pieces about immigration.
These maps show the broad patterns, but miss the remarkable variety of the origins of immigrants to the Toronto region. You can get that by going to the Toronto Star site and tracking immigration from over 120 different countries to the Toronto region.
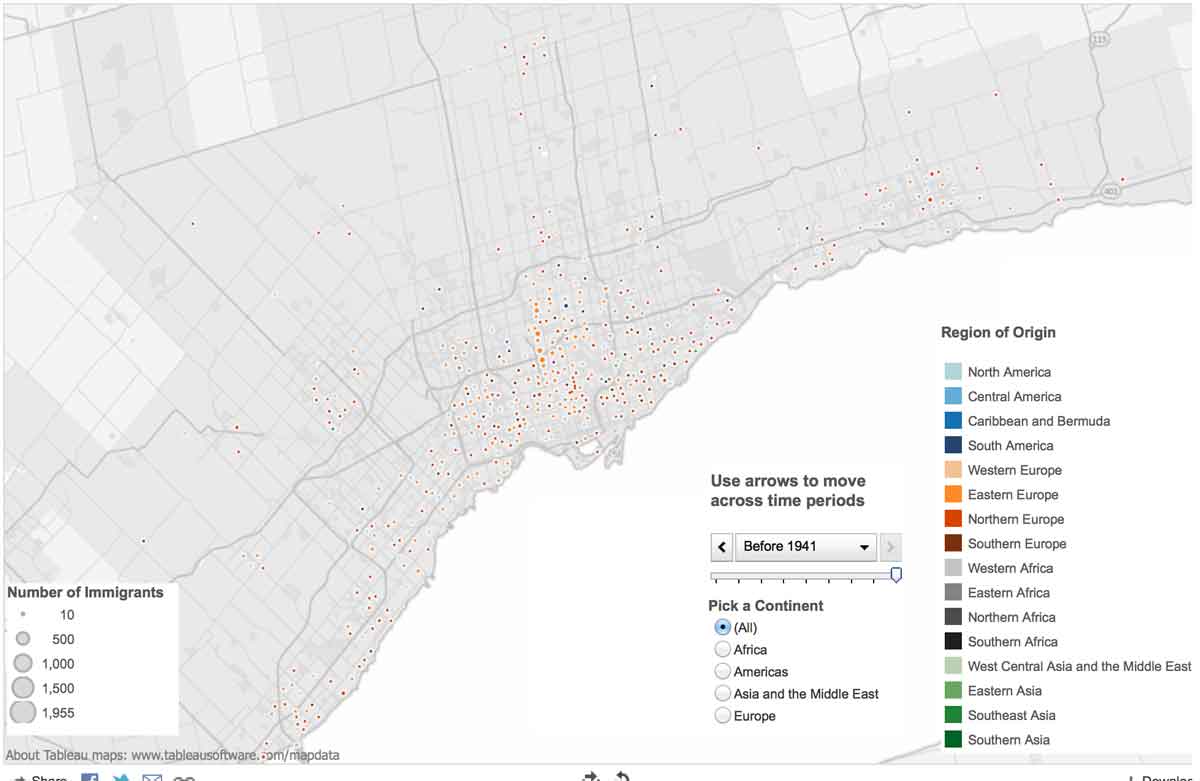
Immigration before 1941 was mostly from the UK, and immigrants settled throughout the Toronto region.
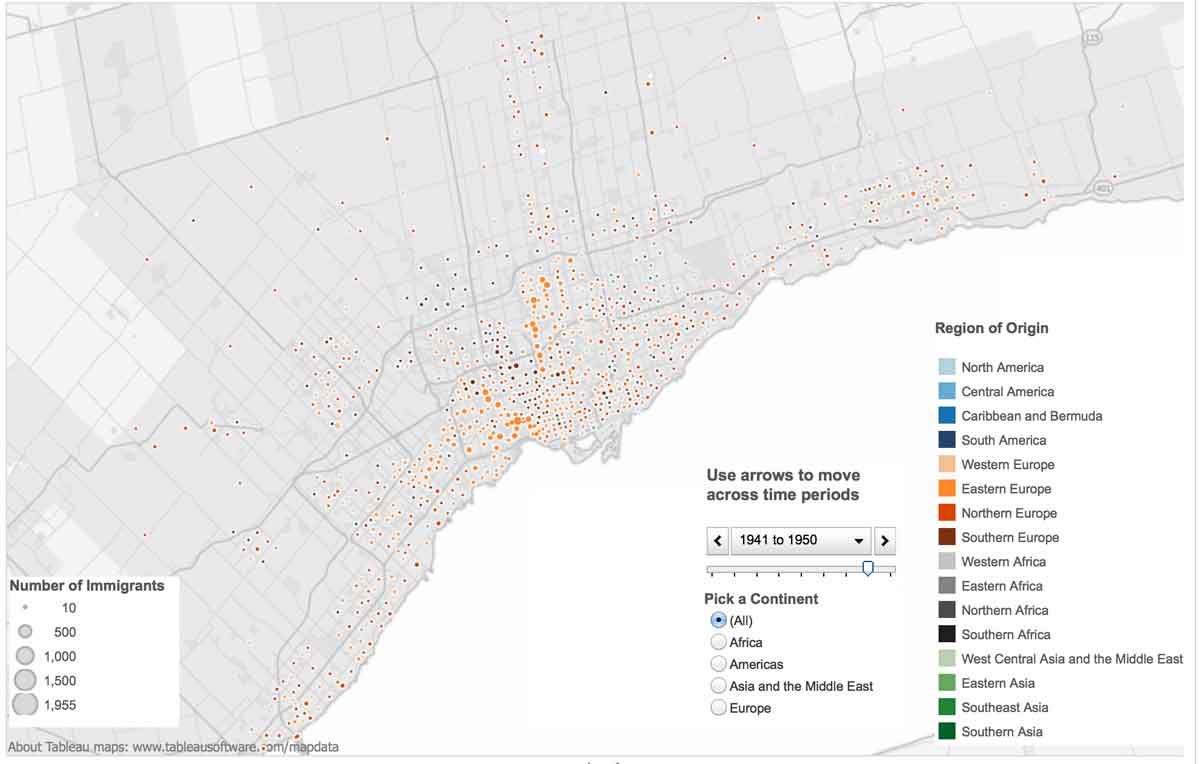
Immigration 1941-1950, which obviously occurred mostly in the years after the war, was again mostly from the UK but also substantial numbers from Germany, Poland, Estonia, Latvia and Lithuania.
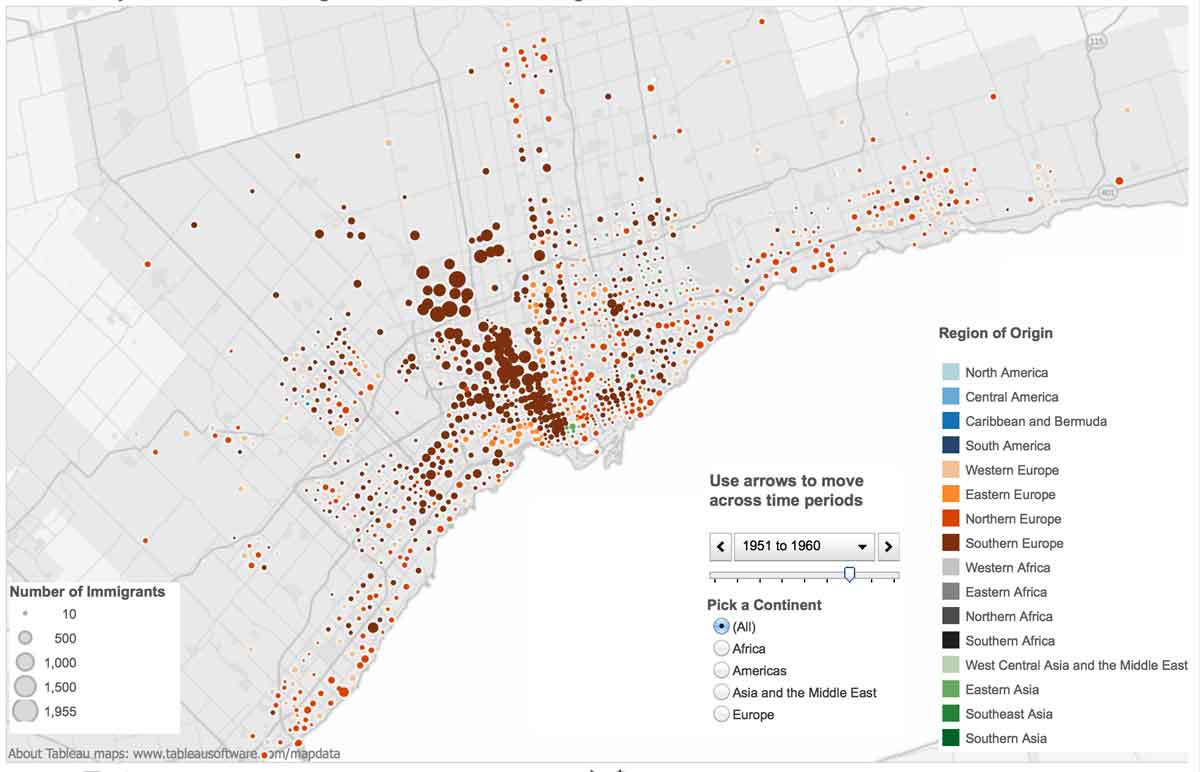
Immigration 1951-60 saw a change. Immigration from western and northern Europe continued, but was supplemented by a wave of immigration from Italy, which was concentrated in a corridor running northwest from downtown along Bathurst into the area around Woodbridge. Italian immigration continued through the 1960s and declined rapidly in the 1970s.
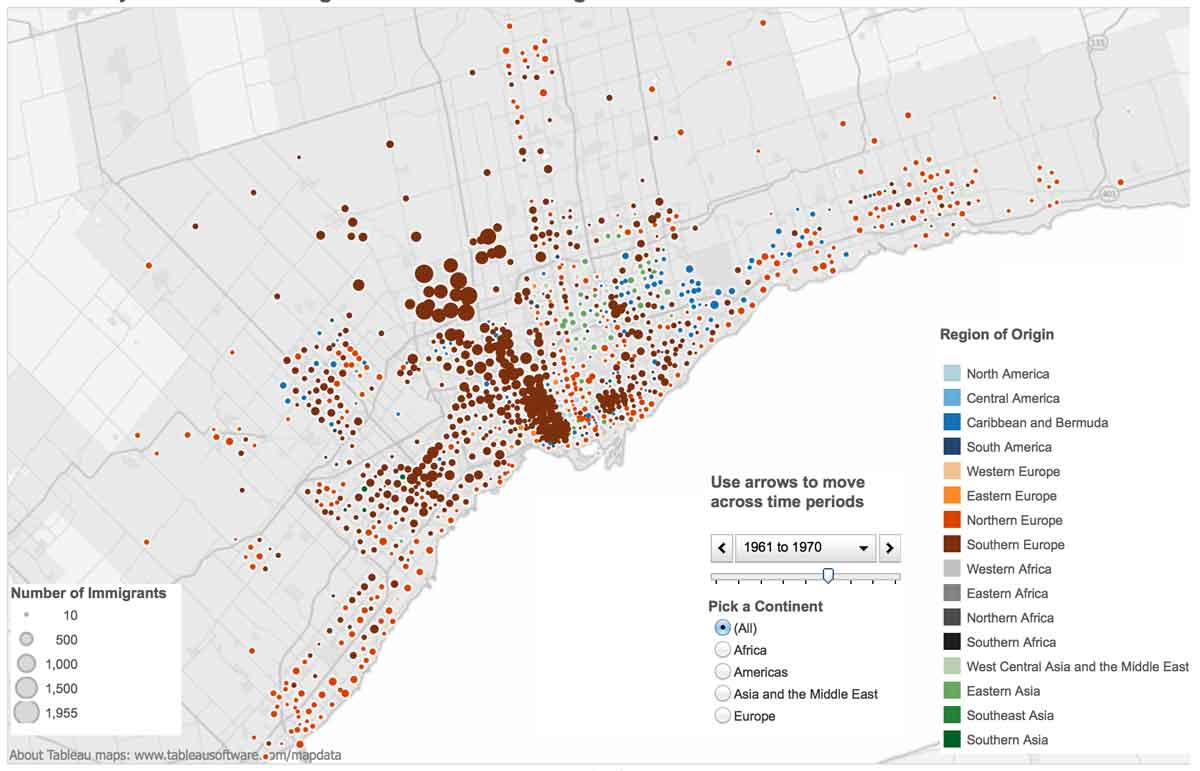
Immigration 1961-70 continued the pattern of the previous decade, with the dispersed settlement of immigrants from the UK, substantial numbers from Southern Europe – mostly Italy concentrated in the Bathurst corridord, but also some from Portugal. Immigration from the Caribbean and East Asia began on a small scale.
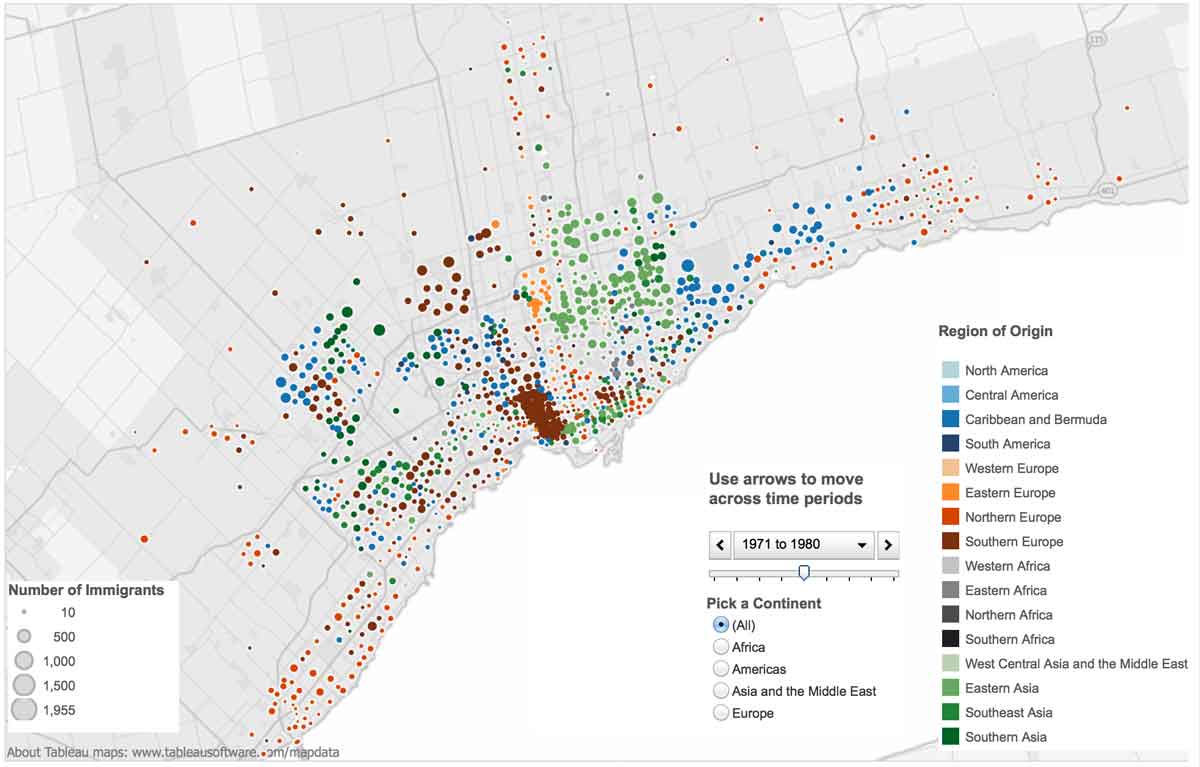
Immigration 1971-1980 included many from Portugal who settled just east of downtown in what came to be called Portuguese Village, and increasing numbers from China and India (especially in the northern part of Metro, Markham, and in Mississauga and Brampton), and from the Caribbean (in norther Scarborough, Brampton and the north-west part of Metro). Immigration from South Asia began.
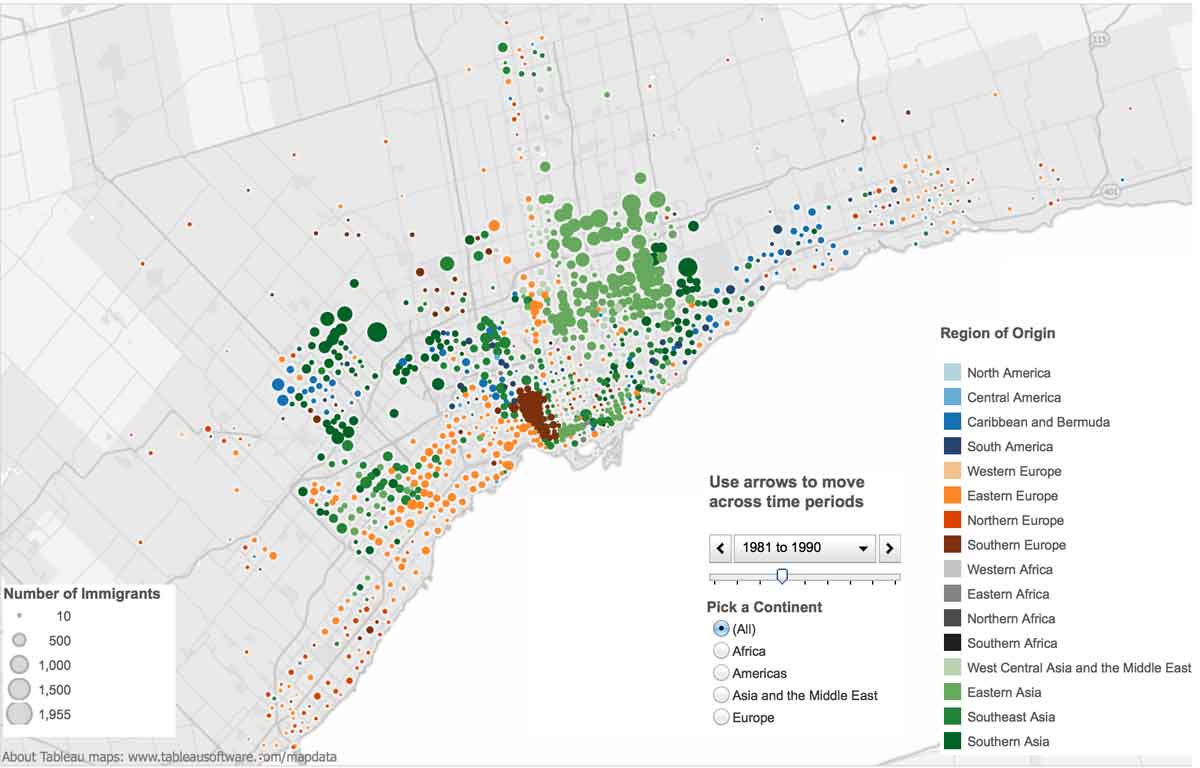
Immigration 1981-90 reinforced the changes that had begun in the previous decade with intensified immigration from China and India. Immigration from Portugal began to decline and from Eastern Europe began to increase. The wave of immigration from Vietnam that had begun in the 1970s was especially concentrated in the 1980s. UK immigrants declined substantially. The majority of new immigrants from the Caribbean and Asia settled in the inner and outer suburbs.
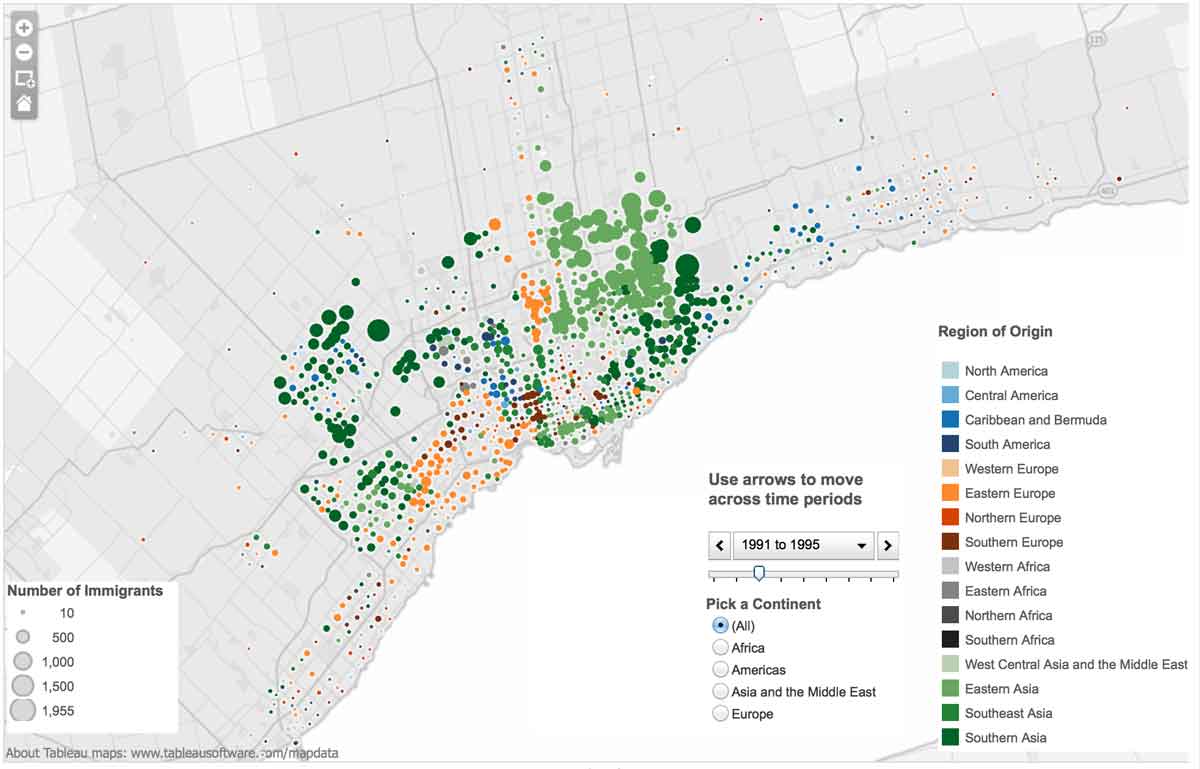
Immigration 1991-1995 was primarily from East and South Asia, and from Eastern Europe – primarily Russia. Immigration from Central and South America was concentrated in the north-west part of Metro, from China in northern Scarborough, Markham and Richmond Hill, and from India and Pakistan in Brampton, Mississauga and Scarborough.
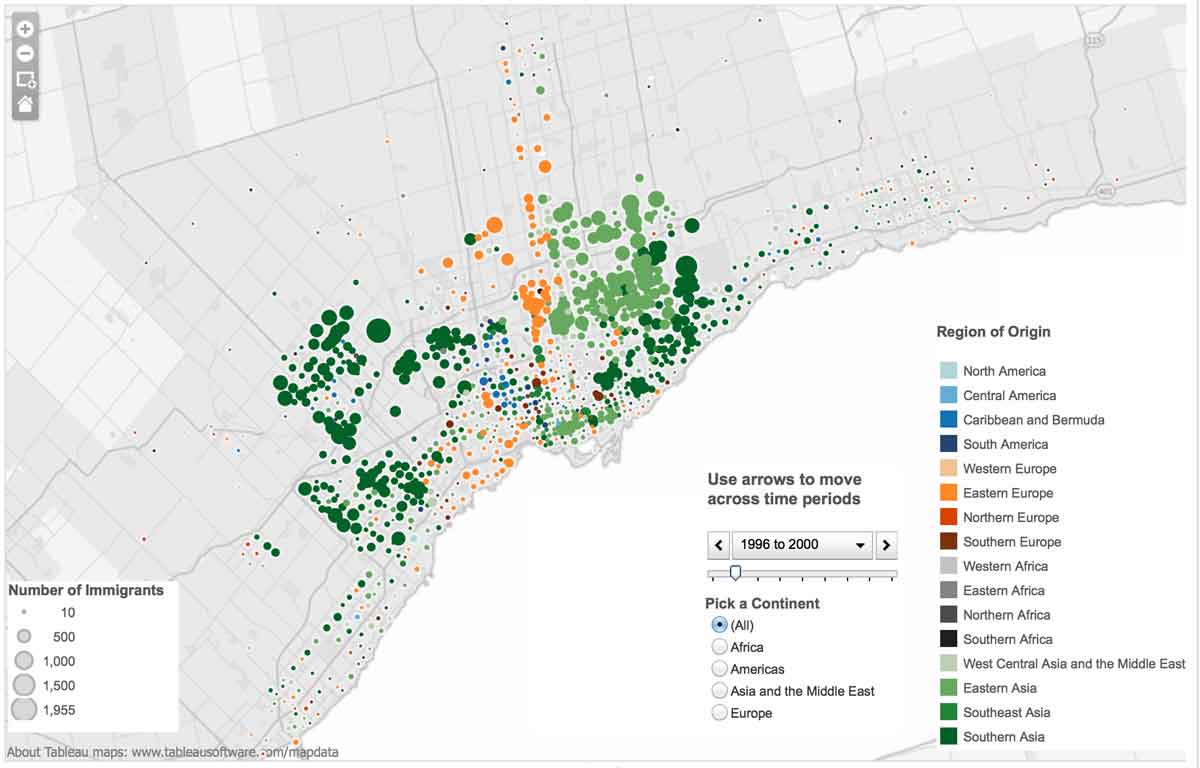
Immigration 1996-2000 continued the same pattern as the previous half decade with the addition of a wave of immigrants from the Philippines.
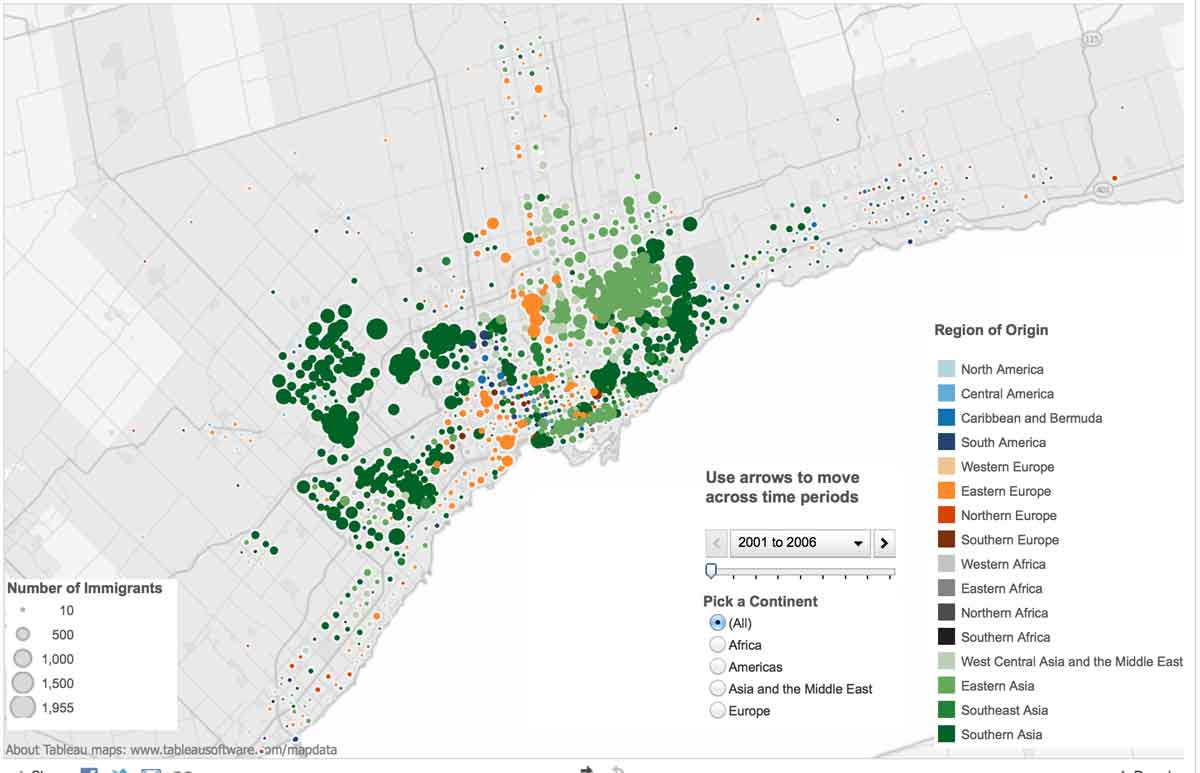
Immigration 2001-2005 – again the pattern of the previous decade with the majority of immigration from South and East Asia, and from Eastern Europe continued and intensified.
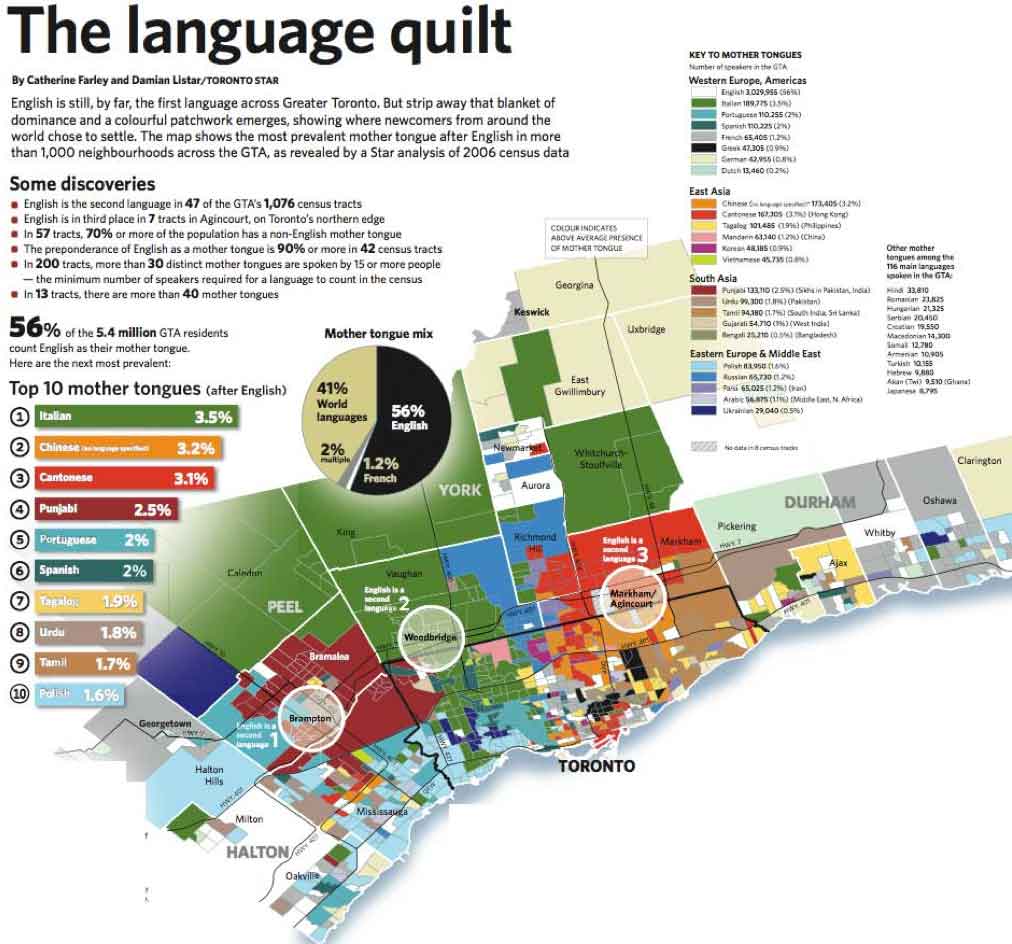
The consequence of the diverse sources of immigration is a region where a wide range of languages other than English or French are spoken at home that is captured in this map of the “Language Quilt” (based on 2006 census data) The original is also from the Toronto Star, but I clipped this from Bricoleur Urbanism which processed a massive file into something “more digestible” (scroll down until you get to it). There it is noted that English was the second language in 2006 in Brampton (to Punjabi), Markham (to Chinese), and Woodbridge (to Italian). There are also details about languages that will shape regional patterns in the future – Urdu, Chinese (because Cantonese or Mandarin is not specified in the Census response), Punjabi, Mandarin, Tagalog, Russian, Farsi and Spanish.
Finally, a reference to article on “Toronto’s Ethnic Buffet” from the New York Times (that I read the day I posted this – 2 March 2014) that celebrates the cultural diversity of Toronto and offers a welcome reminder by an outsider that the constant silly distractions associated with the City of Toronto’s current quasi-Mayor Rob Ford are in no way representative of the city (who, thankfully, the author Francine Post does not mention. She does say, incidentally, that there are at least three Chinatowns in the Toronto metropolitan area, but the actual number is closer to ten.)