 This is part of the companion website to my book Toronto: Transformations in a City and its Region, published by UPenn Press. It still needs to be proof-read to correct typos, check links, adjust the formatting, and acknowledge all the sources.
Background to Growth
There are few physical impediments for urban growth in the Toronto region – no mountains, no significant threats of earthquakes or tornadoes or storm surges. Except for the steep-sided ravines of the rivers that flow into Lake Ontario, most of it is more or less flat, and the geology is soft and easily remodelled to make way for new subdivisions or plazas.
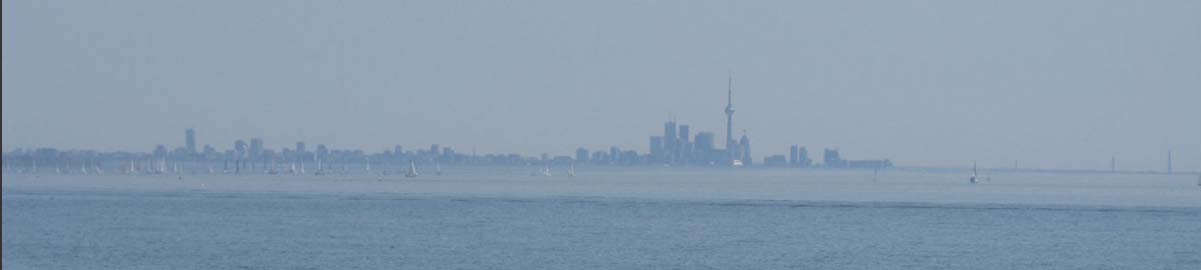
A telephoto view of central Toronto seen from Rattray Marsh near Oakville.
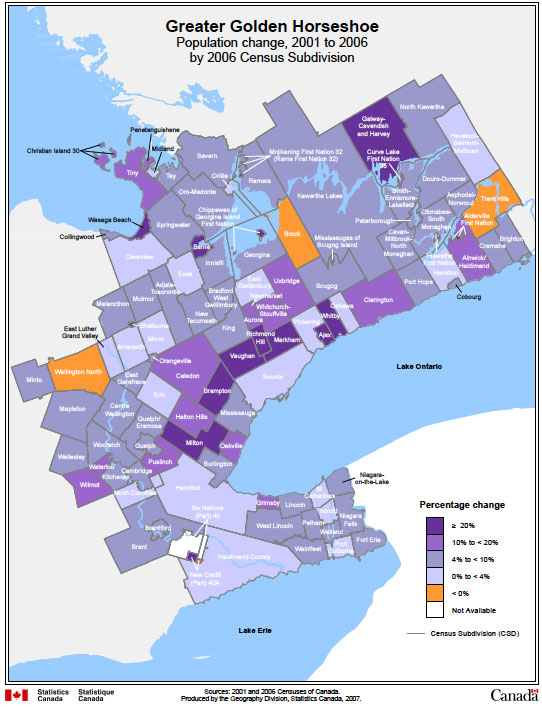 One consequence of the flatness has been that the built-up area has spread inexorably outwards from the original town of York, leaping the ravines as soon as it proved possible to bridge them. Until recently this showed no signs of abating. This map from Statistics Canada of population change in the Greater Golden Horseshoe from gives a snapshot of the process from 2001-2006 – the dark purple is the wave of greatest growth, then in the outer suburbs adjacent to the City of Toronto but moving steadily into the areas of paler purple beyond it. Since 2006, however, this process has been challenged by three major regional planning initiatives that aim to constrain a two century long habit of outward urban expansion.
Precedents for Regional Planning
In Chapter 9 I write about previous attempts to think about and organize urban growth in the region. The matrix of the megagrid of arterial roads, which is the modern incarnation of the original settlement survey, has unquestionably structured the shape of development. And the extended planning region of Metro Toronto allowed it to promote a contiguous urban form with a clean urban edge (discussed Chapters 4 and 6 of my book and the related entries here). Below are some of the other ideas that have been less successful.
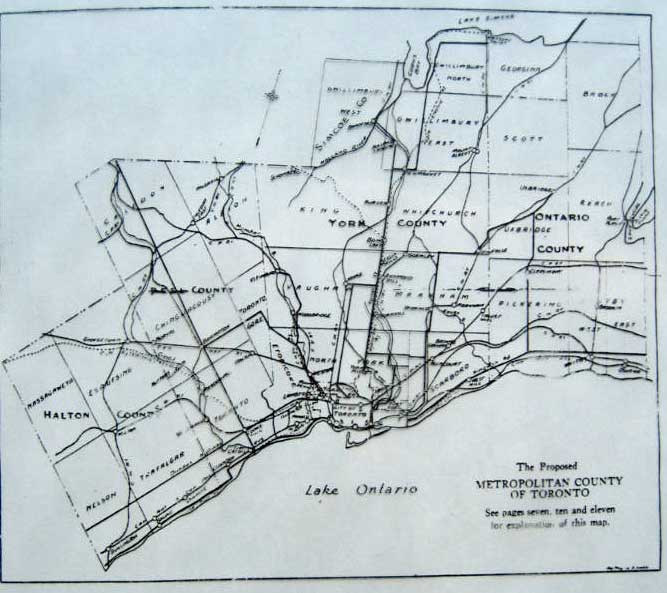
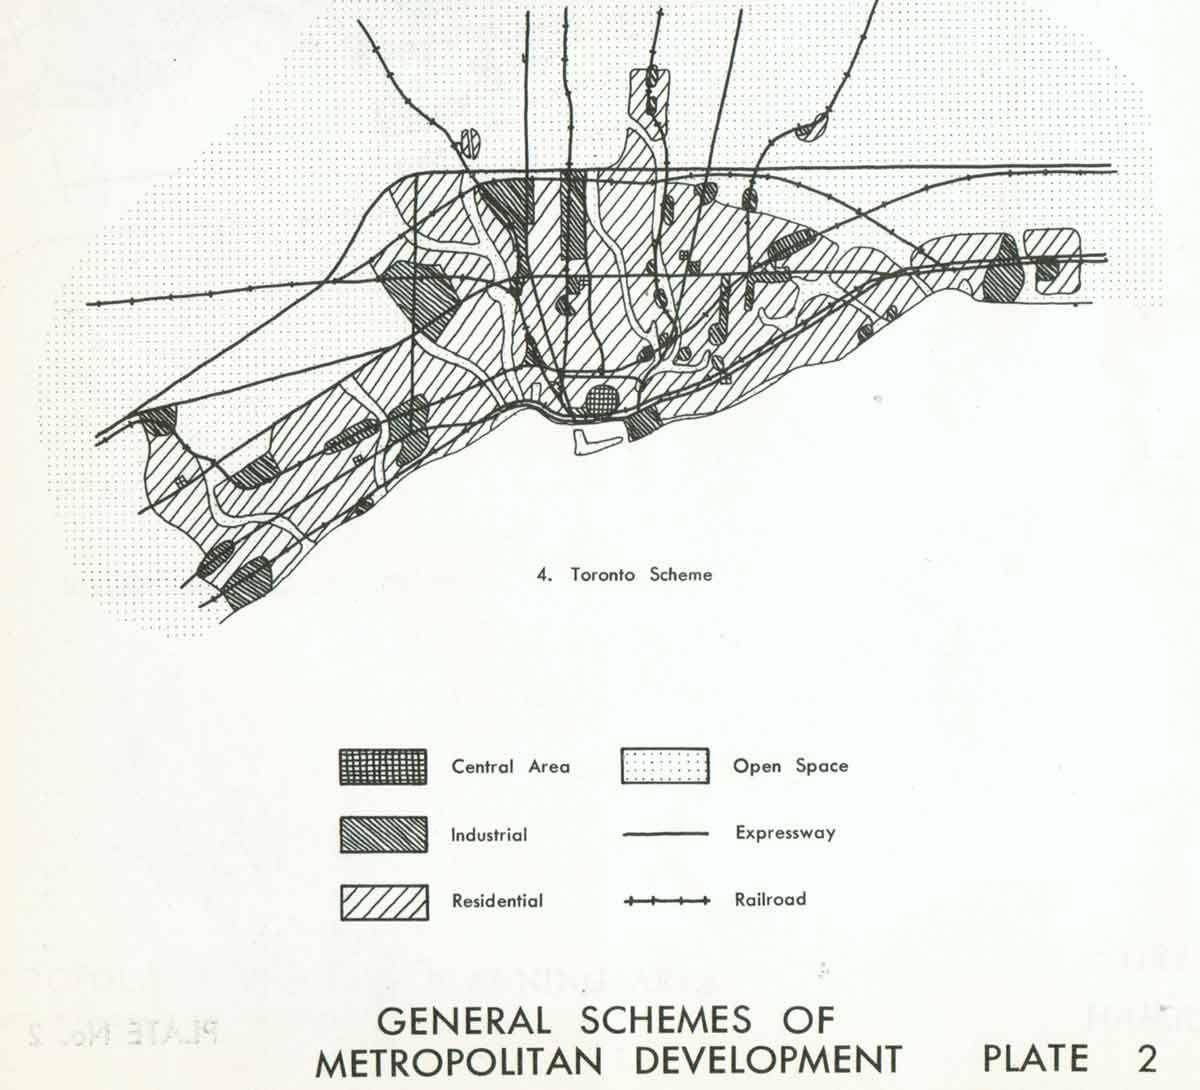
On the left is a 1929 map by John Fisher proposing a Metropolitan County of Toronto, an area similar to the Greater Toronto Area (this is copied from Wayne Reeves, “Regional Heritage Features on the Metropolitan Toronto Waterfront”, 1993). Nothing came of it. On the right is a map from the 1959 Metro Toronto draft official plan proposing future urban growth concentrated in a broad strip adjacent to Lake Ontario to take advantage of water and sewerage services along the lakeshore.
.
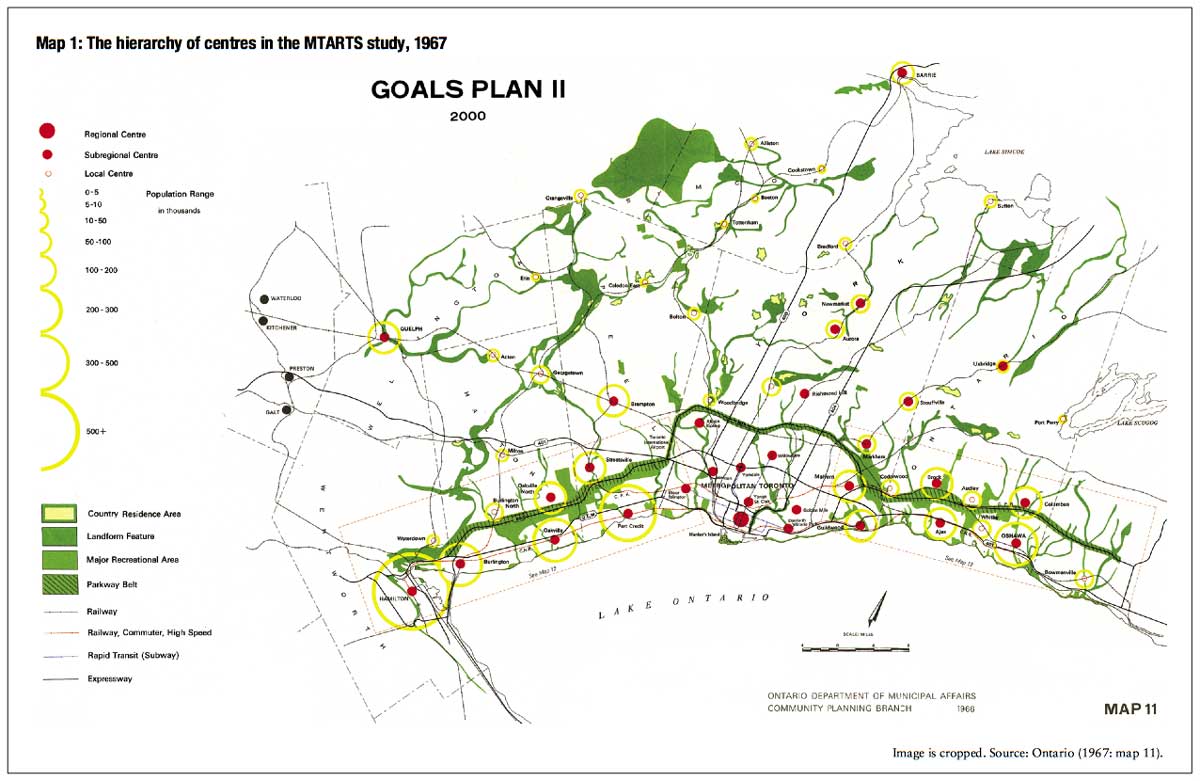
In the 1950s and 60s Metro was a powerful planning body and its proposal was adhered to until the mid 70s. However, in the mid 60s the Province of Ontario began to take an interest in regional planning, initially through MTARTS (Metropolitan Toronto and Region Transportation Study) that was the first to consider Toronto and Hamilton as a single planning region and to introduce the idea of development nodes, or regional sub-centres, and a parkway belt. This 1967 Goals Plan is from Pierre Filion “The Urban Growth Centres Strategy in the Greater Golden Horseshoe” Neptis 2007.
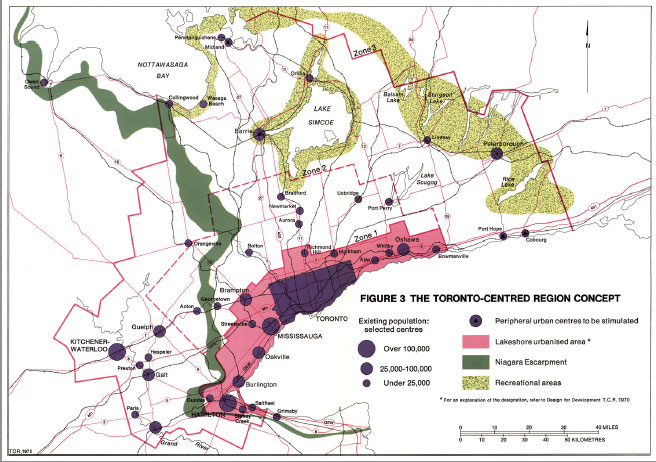
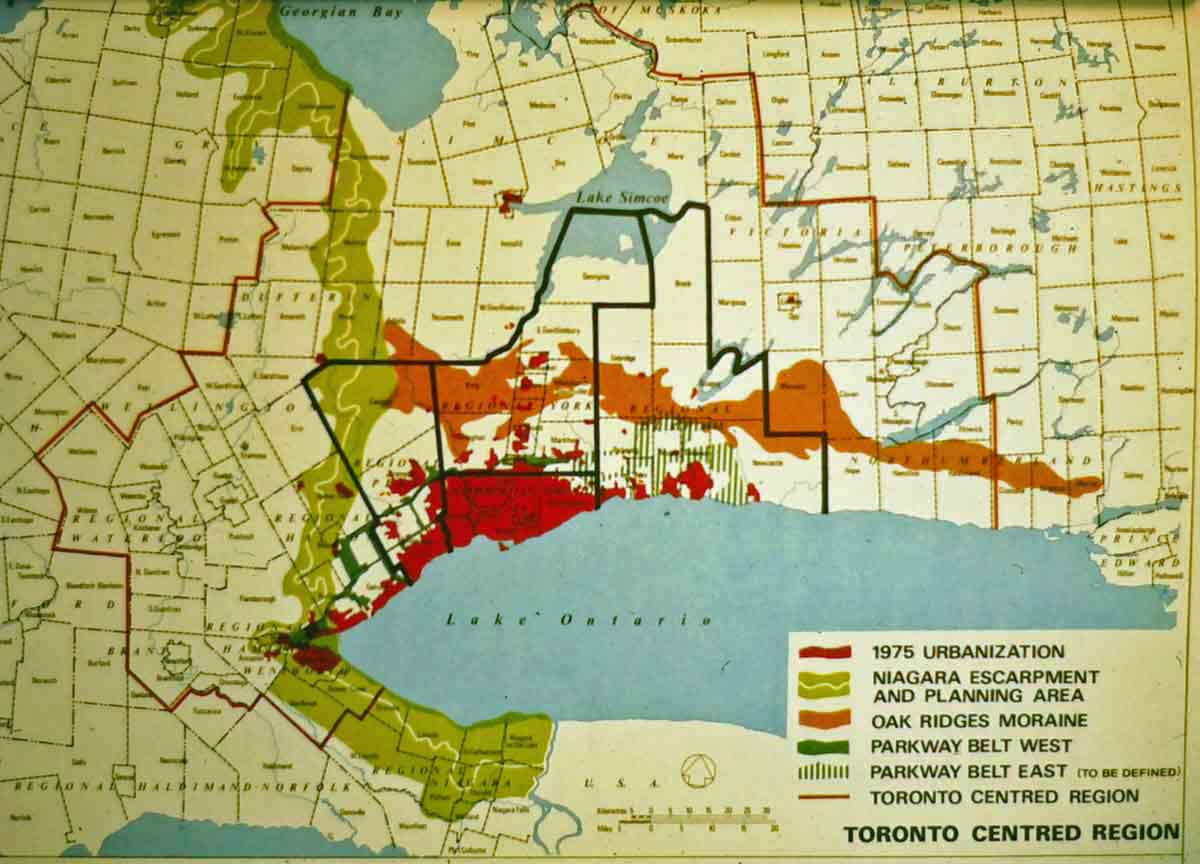
MTARTS was a massive data gathering study that morphed into various proposals by the province for the “Toronto Centred Region” between about 1969 and 1975. Again, very little substantial came of these, but they did indicate growing awareness of the consequences of urban growth beyond the borders of Metro. The map on the left below is from about 1970, and reinforces the ideas of a band of urban development close to Lake Ontario with growth around sub-centres, and it identifies the Niagara Escarpment, presumably as a protected area. The map on the right from 1975 shows a planning region that corresponds to the Greater Golden Horseshoe with the Greater Toronto Area outlined, and it adds the Oak Ridges Moraine, so most of the elements of the current regional plans are embedded in these two maps. I am not sure where I got these particular versions , but Richard White “The Growth Plan for the Greater Golden Horseshoe in Historical Perspectives”, Neptis 2007, provides an excellent overview of the Toronto Centred Region proposals
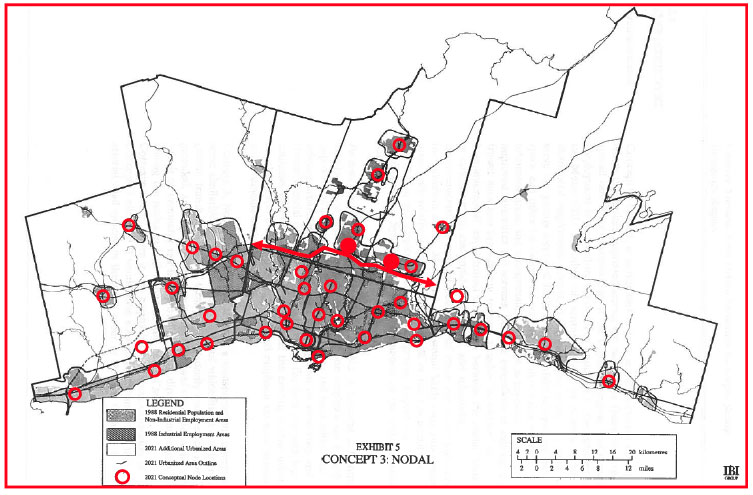
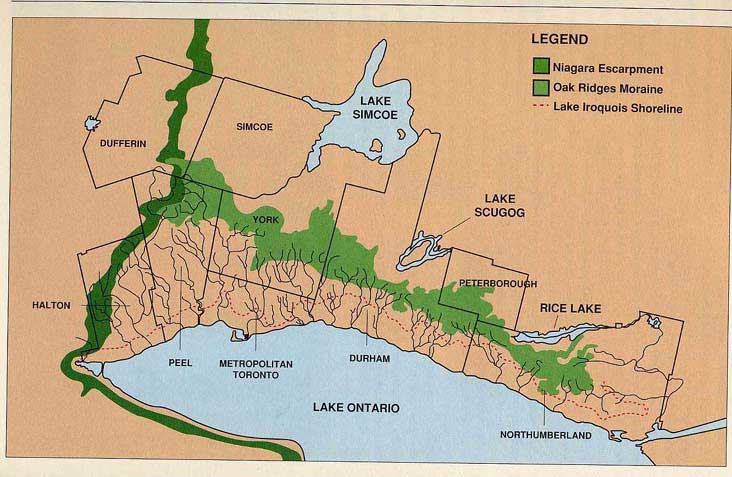
I discuss what happened after about 1970 in Chapter 9 – the province created regional municipalities and funded sewer construction to promote northwards growth and, except for the creation of parkway belts (actually utility corridors for power lines and expressways), these reports were filed away. But the urban area continued to grow, and about 1990 all three levels of government and local environmental groups more or less simultaneously realised this required attention. The province commissioned a study of growth options by the consultant firm IBI, and this identified three possibilities – Spread (aka sprawl or business as usual), Compact (fit future growth into existing built-up areas) and Nodal – and argued that Nodal was the most cost effective. The map on the left shows the 1991 Nodal proposal (from a presentation by Neil Irwin, one of IBI senior planners). The federal government commissioned an investigation into Toronto’s waterfront (where it owned property) and this was developed by David Crombie into the innovative Regeneration report on Toronto’s bioregion; the map on the right is shows the bioregion of watersheds of southward flowing rivers defined by the Niagara Escarpment and the Oak Ridges Moraine.
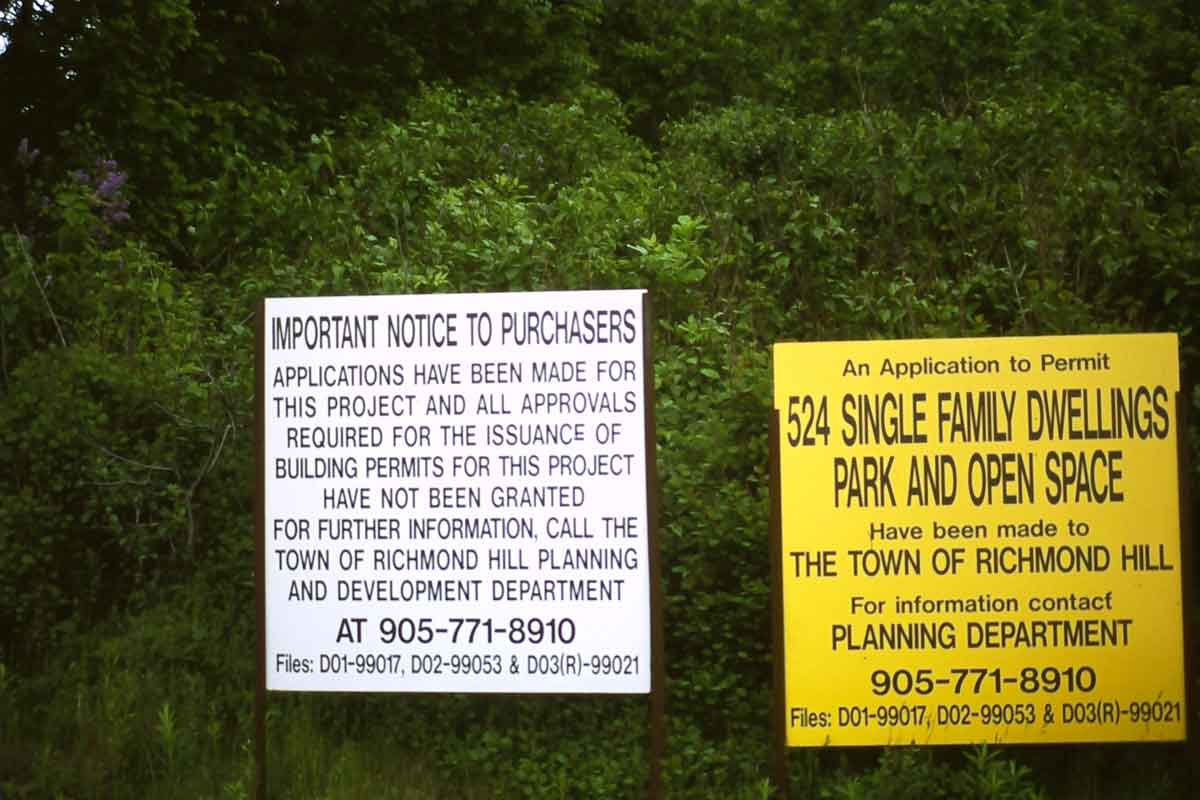
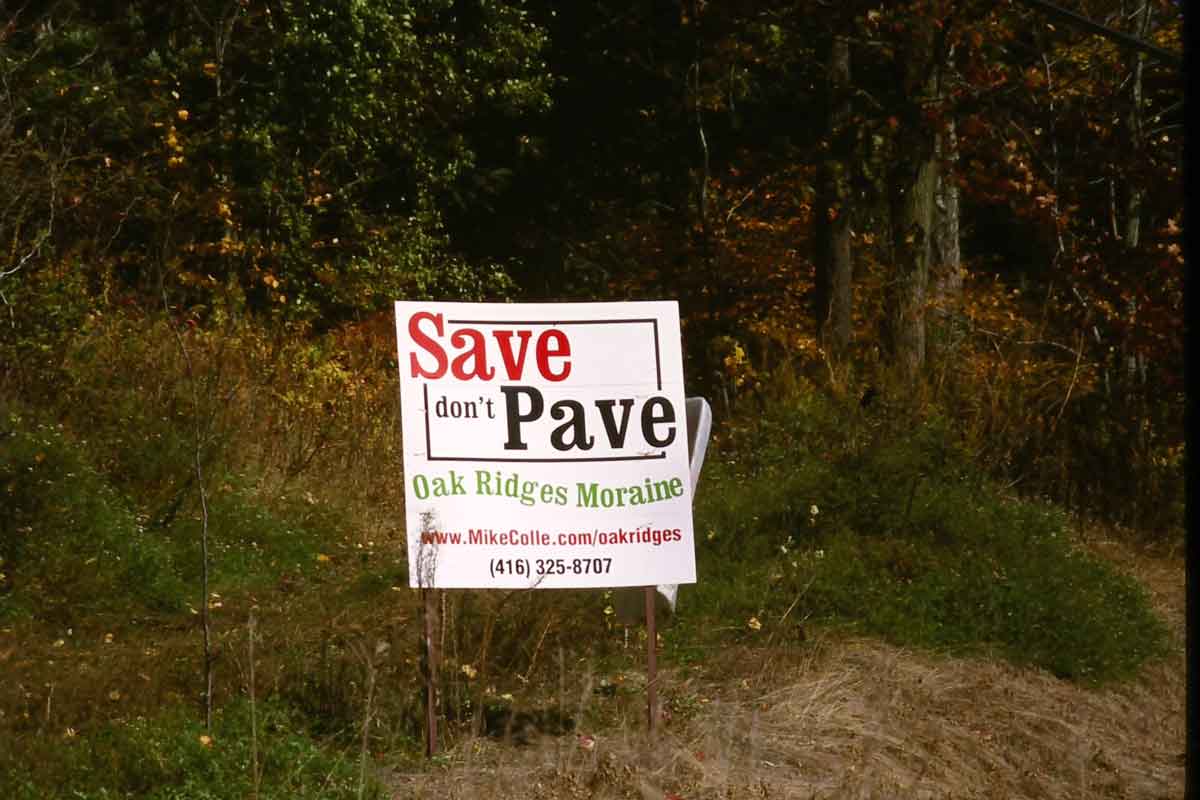
In the 1990s environmental groups became increasingly alarmed by urban development of the Oak Ridges Moraine where the headwater of those rivers are, and mounted a forceful campaign to protect it from urban growth. These two photos of contrary signs on the Oak Ridges Moraine are from the late 1990s.
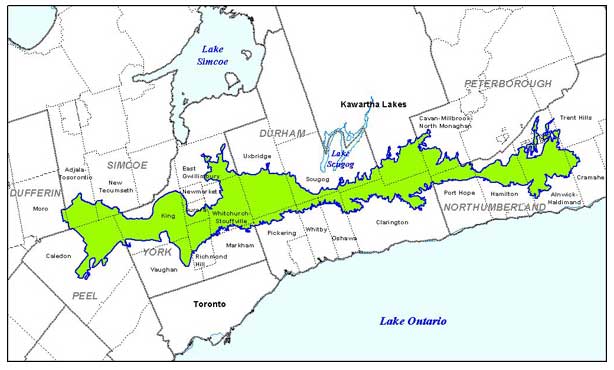
In 2002 the province passed the Oak Ridges Moraine Conservation Plan that effectively prevented future large scale subdivisions in the area shown on this map from the Ontario Ministry of Municipal Affairs.
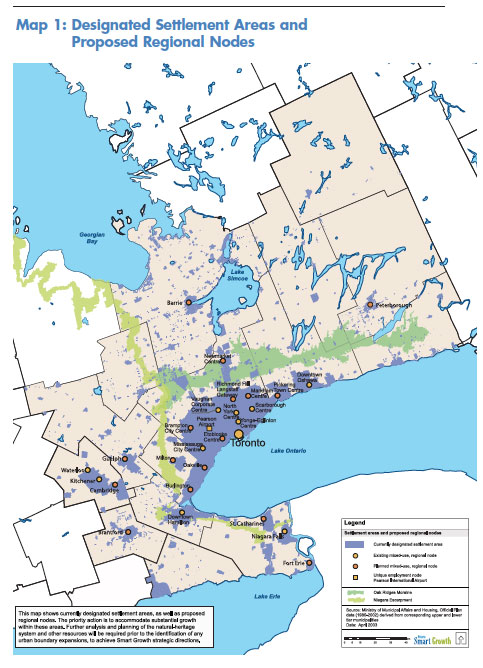
At about the same time the provincial government established, for political as well as planning motives (as I explain in Chapter 9), what it called Smart Growth Panels for Central Ontario to develop proposals for directing long-term environmental protection and urban growth. What emerged from these Panels was the precursor to the Growth Plan for the Greater Golden Horseshoe. Here’s the key map from the 2003 Smart Growth report called Shape the Future.
In short, elements of the current three regional plans can be traced back to the MTARTs proposals of the mid-1960s (the Greater Toronto and Hamilton Area as the basis for transportation planning), they evolved through the Toronto Centred Region Plans (nodal development, first suggestions of Niagara Scarp and Oak Ridges Moraine as protected areas), then were reinforced by the IBI and Regeneration reports of the early 1990s, (the Niagara Escarpment was declared a UNESCO World Biosphere Preserve in 1990) and were given substance in the ORM Conservation Plan and the Smart Growth proposals of 2002/3. From there it was a short step to the Greenbelt, the Growth Plan and the Big Move.
The Greenbelt Plan
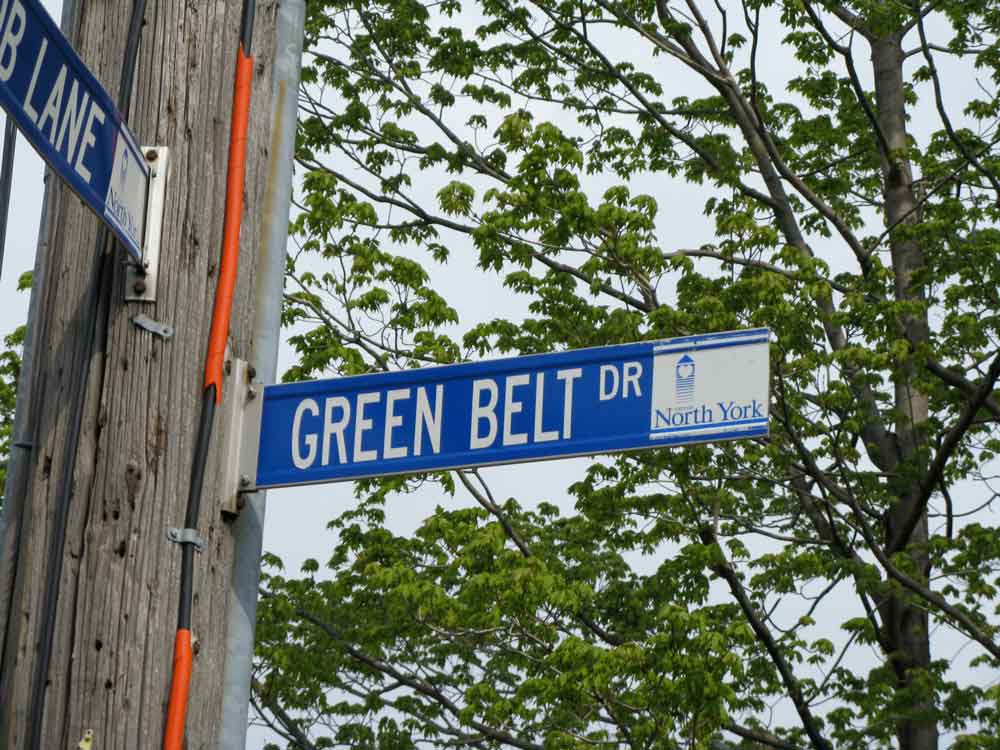
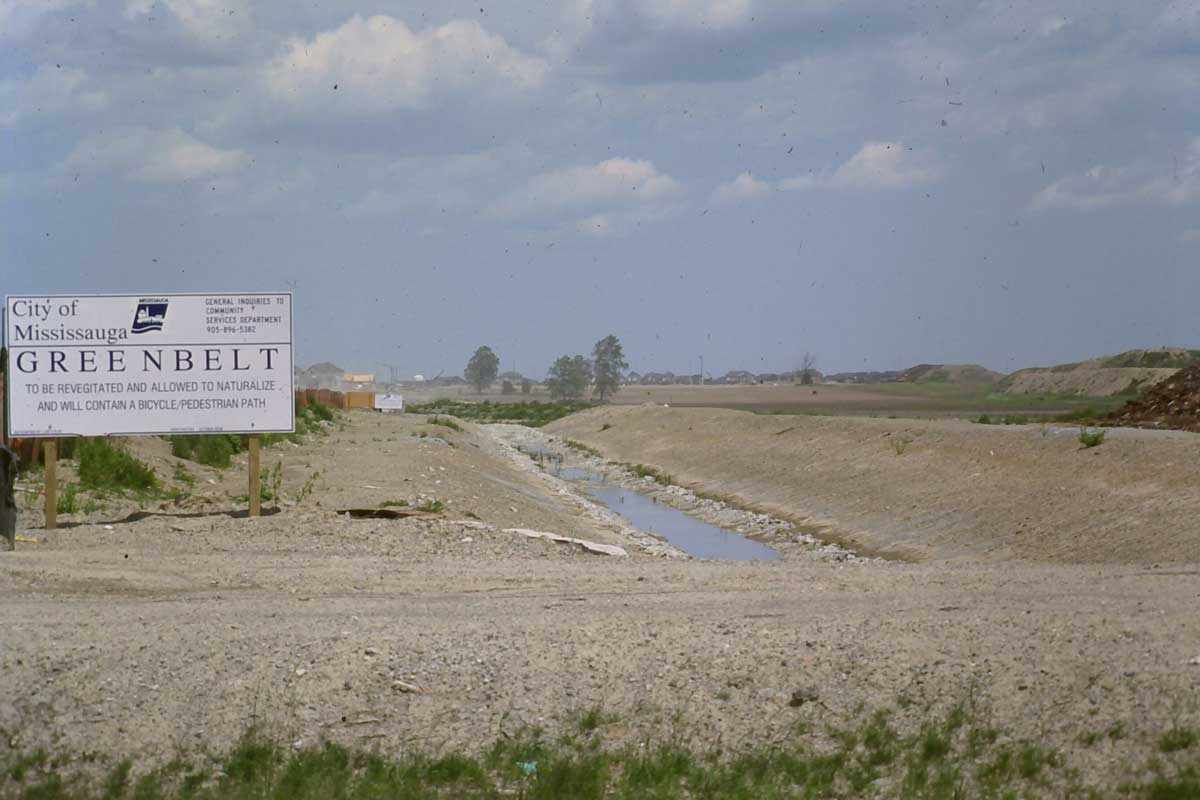
The idea of greenbelts around Toronto was not new. The 1943 Plan (discussed in Chapter 3) had proposed them. Don Mills in the 1950s had one that is acknowledged in a street name (on the left below); Mississauga has one, though when this photo was taken in 1999 there wasn’t very much green about it.
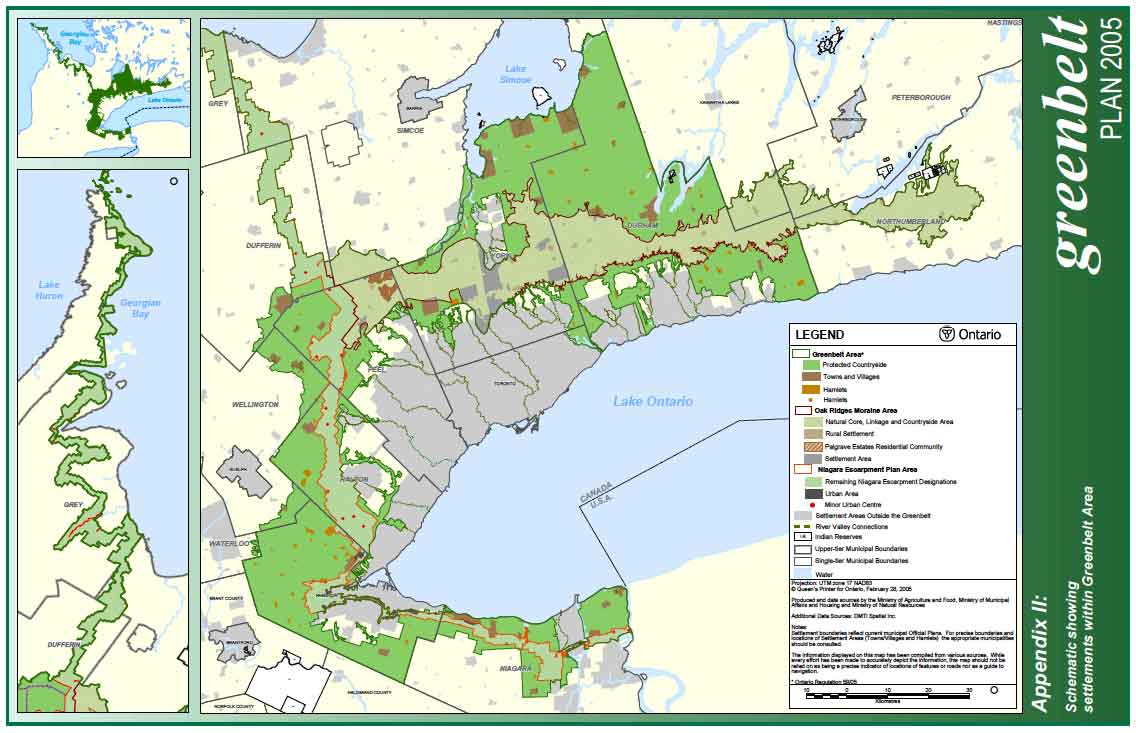
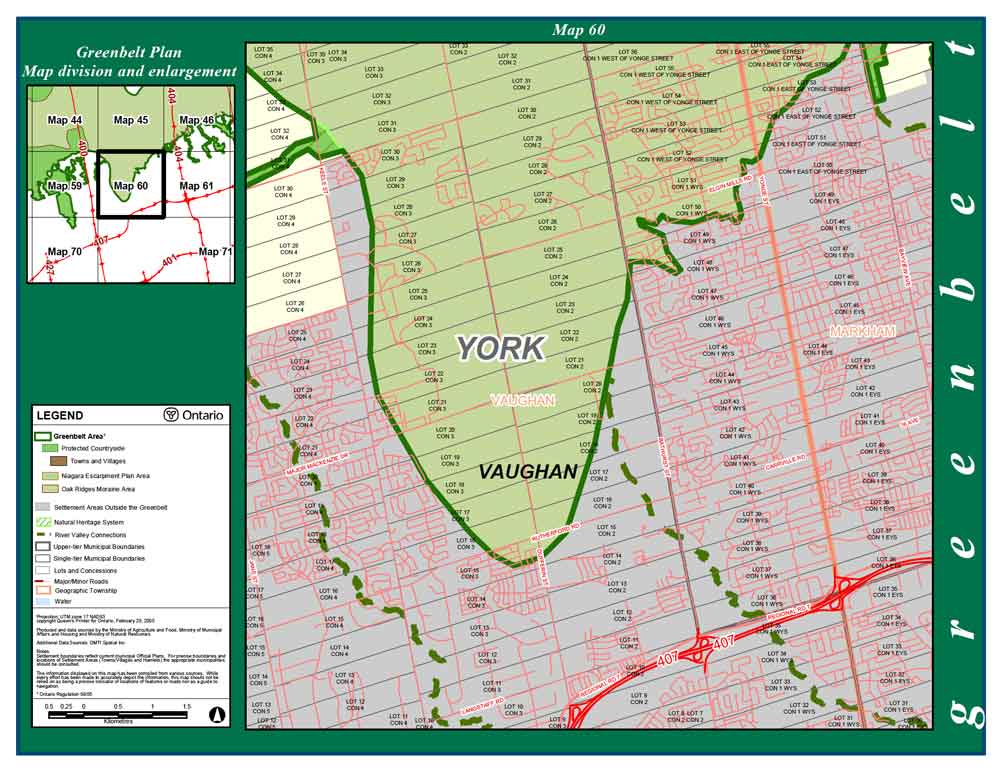
But the Greenbelt that was established in 2006 was on an entirely different scale, combining the Niagara Escarpment and the ORM to create a broad band surrounding the built-up urban region of Toronto. This is the map from the Greenbelt Plan. The Greenbelt includes the areas of the Niagara Scarp and the Oak Ridges Moraine, shown in paler greens, and “protected countryside” shown in darker green. The grey are urban areas and the narrow strip between the grey and the green is the area (sometimes called the ‘whitebelt’) left for urban expansion.
This photo is Roger Keil’s. and I have taken it from a book he edited called Suburban Constellations, published by Jovis Verlag, 2013
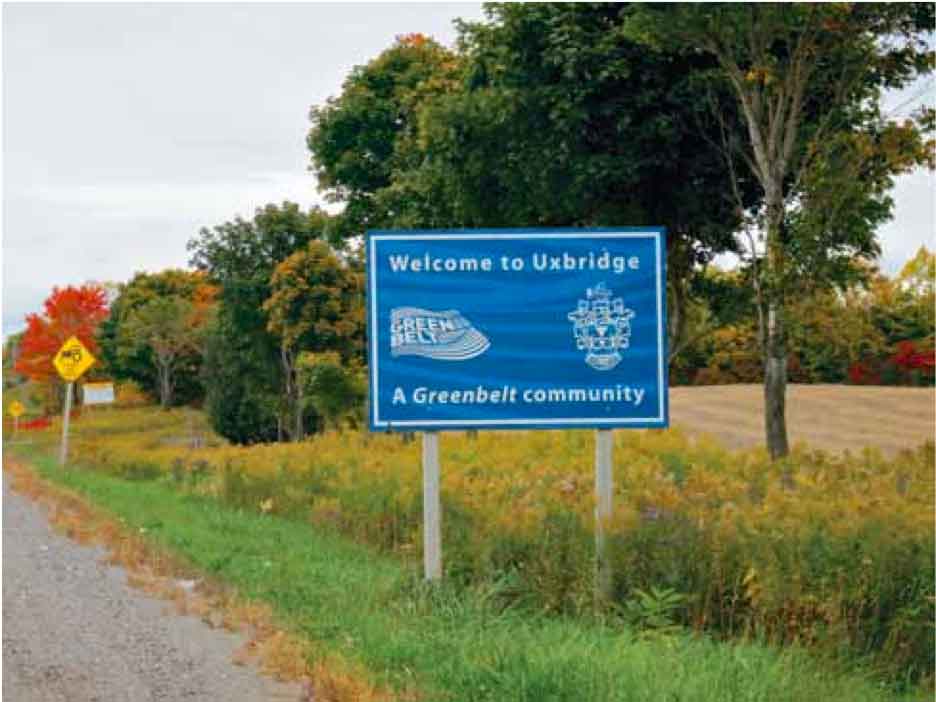
The implementation of the Greenbelt has been accompanied by a massive project of landscape branding. Big blue signs on all the major roads announce “Entering the Greenbelt”, and more modest signs at the borders of small towns, such as this one for Uxbridge, declare that they are Greenbelt communities. Other signs identify the Oak Ridges Moraine, Part of the Greenbelt, and so on. These are intriguing, not least because there is no obvious change in topography or vegetation, so the signs presumably correspond to lines on maps.
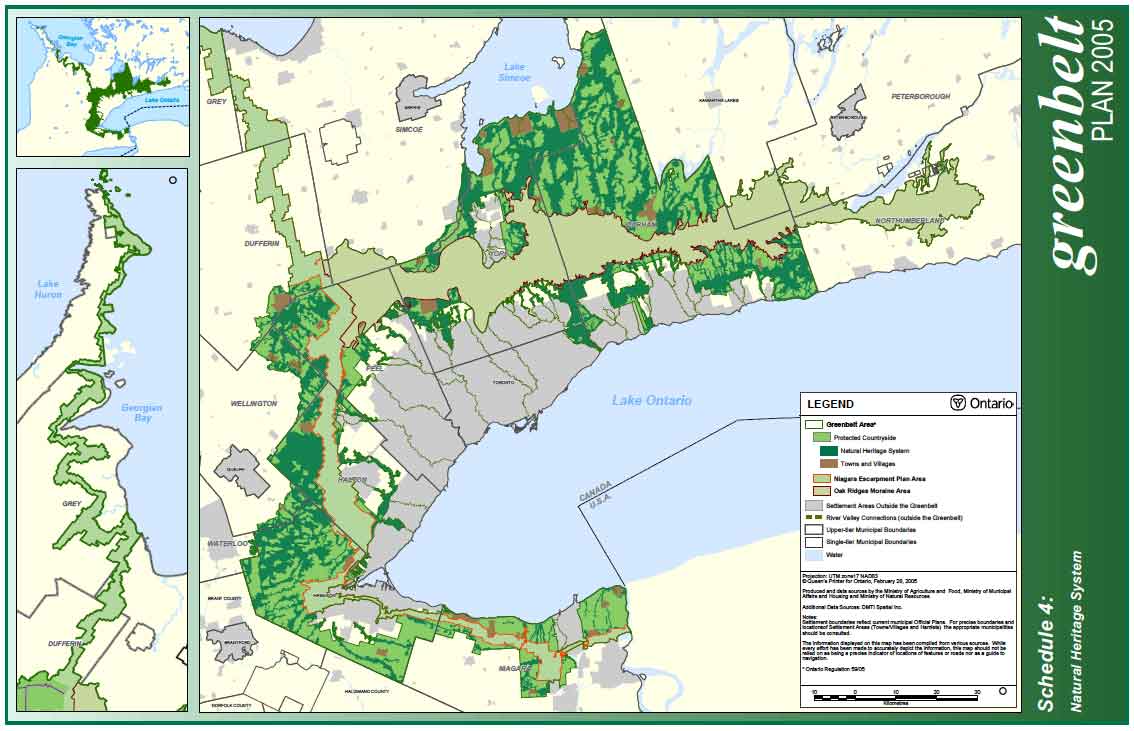
One important aspect of the Greenbelt that I discuss in Chapter 9 is its identification of areas of Natural Heritage (a term that I note is nowhere clearIy defined and which I find confusing). These substantial natural heritage areas are shown in the map below in the darkest shade of green; these have been removed from any sort of economic activity. Here are links to the Ontario Natural Heritage Centre and the discussion of natural heritage in the City of Toronto Official Plan that I discuss in my book.
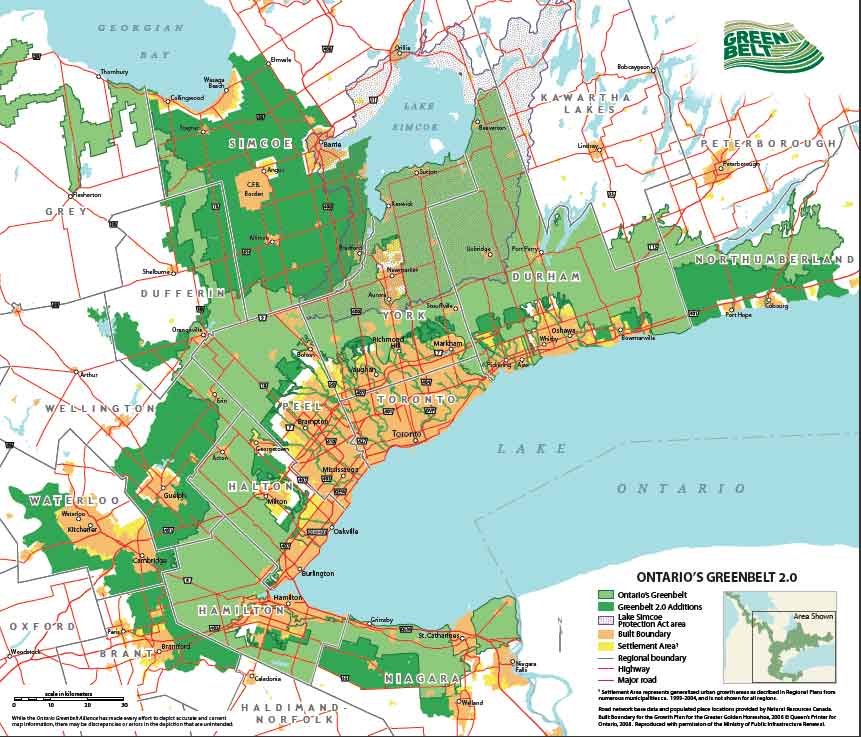
There is an enthusiastic website called Friends of the Greenbelt Foundation (actually an Ontario government sponsored group – note that the contact address is on Yonge Street in downtown Toronto) that once suggested that the Greenbelt needs to be greatly expanded in order to protect most of the farmland and natural areas in Central Ontario, stretching to Georgian Bay. This map of Greenbelt 2.0 was on their website about 2010, but has since been removed, perhaps because it pushed the anti-urbanization agenda too far. The proposed additional areas are in dark green.
The Friends of the Greenbelt website seems to be intended to promote all things positive about it. Here, for instance, is the footer that is being used in November 2013. [Note: there is also a Greenbelt Alliance that is a coalition of environmental groups that monitors the state of the Greenbelt].
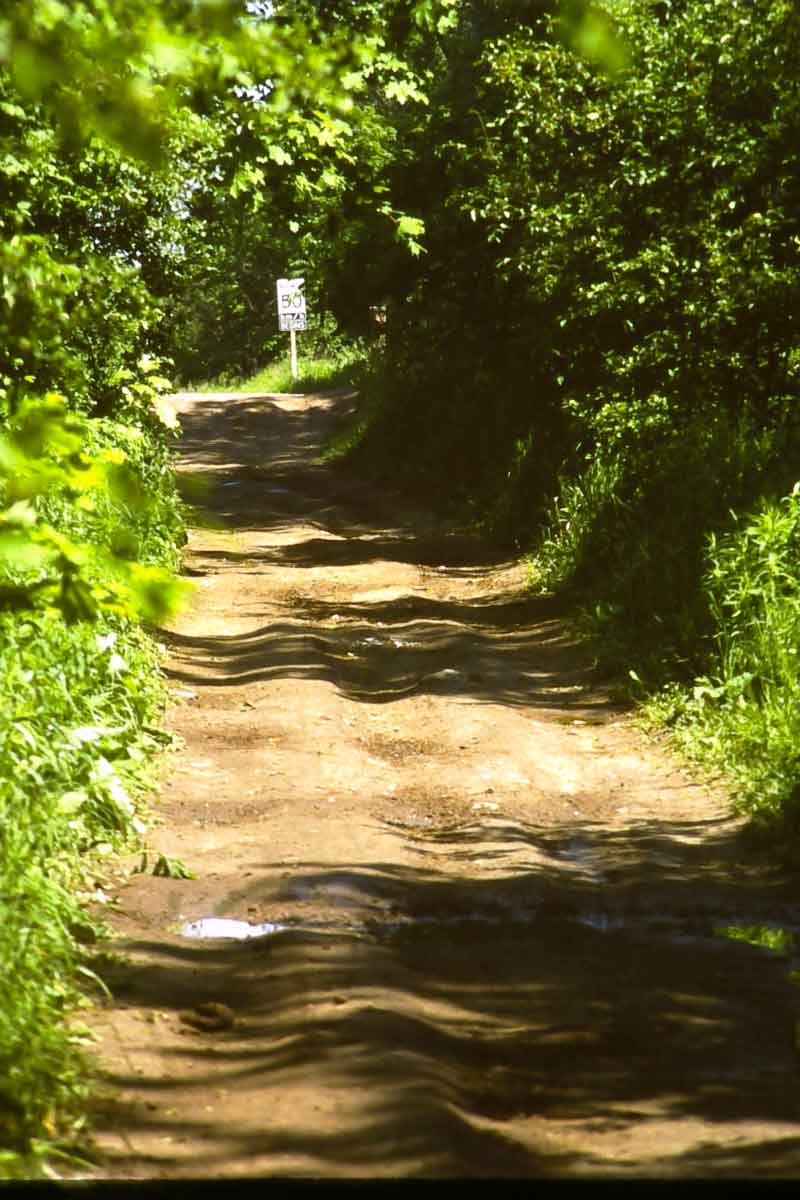
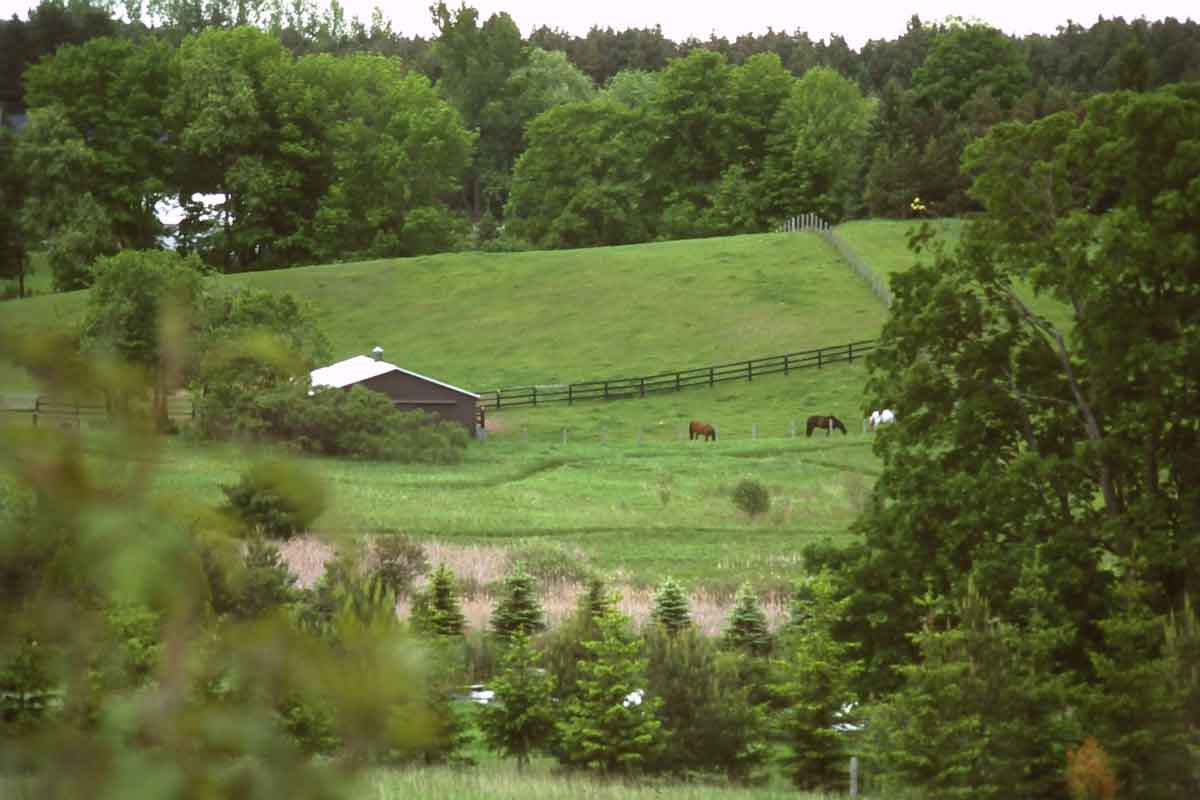
The Friends of the Greenbelt website is also filled bucolic images that suggest it is all attractive countryside, filled with farms and recreational possibilities, the sort of thing suggested by these two photos of mine. The farm with horses is near Kettleby, the photo of the dirt road is one I took of what was the extension of Bayview Avenue before it was widened into a four lane arterial road about 15 years ago.
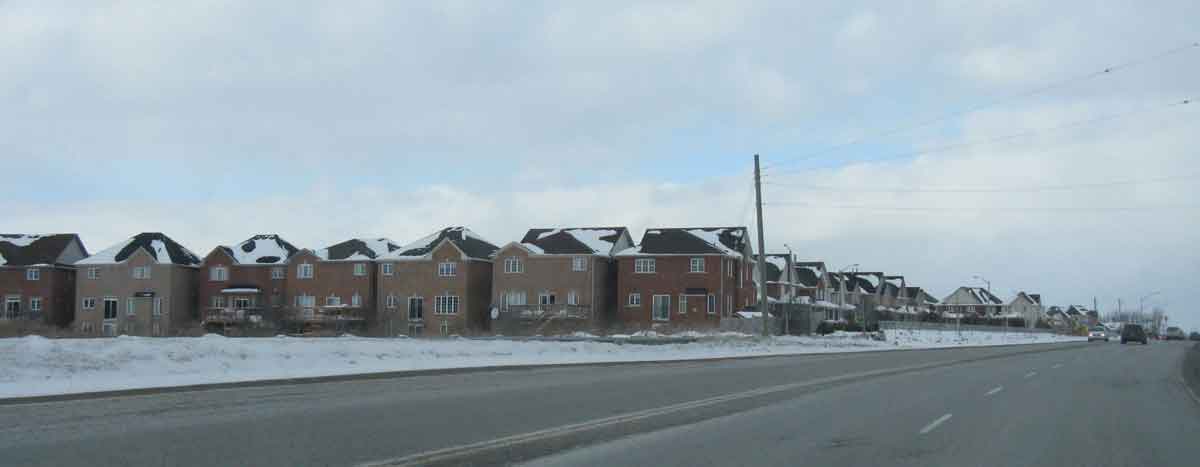
There are indeed many landscapes in the Greenbelt similar to these, but much of the reality is somewhat less bucolic. Below is a subdivision, presumably approved before the Greenbelt Plan and Conservation Plan were implemented, adjacent to the new section of Bayview Avenue (and close to where the section of dirt road shown above had been).
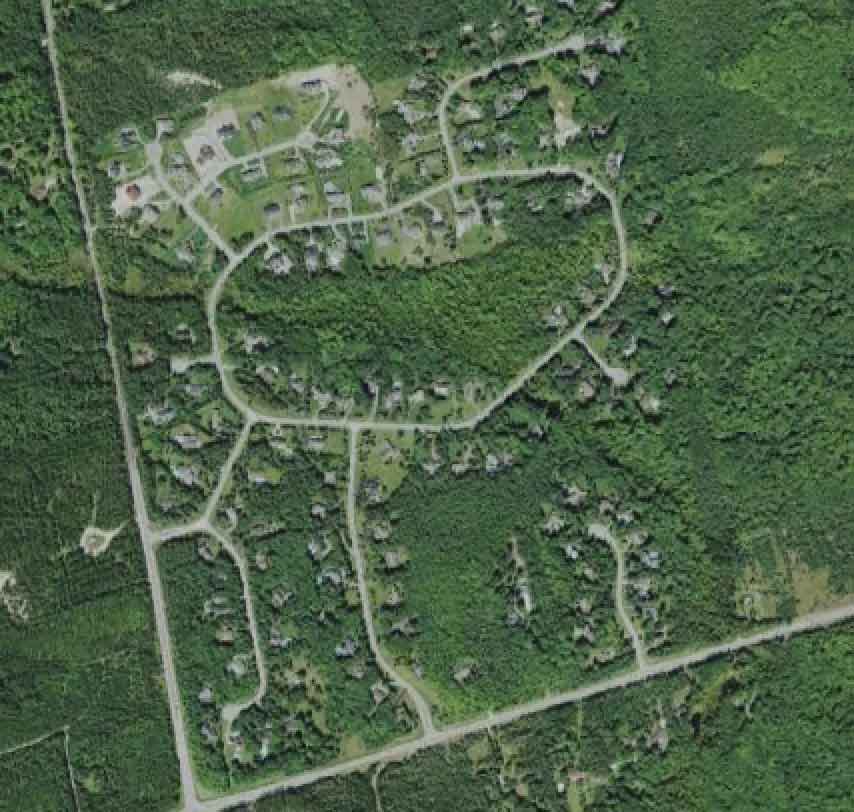
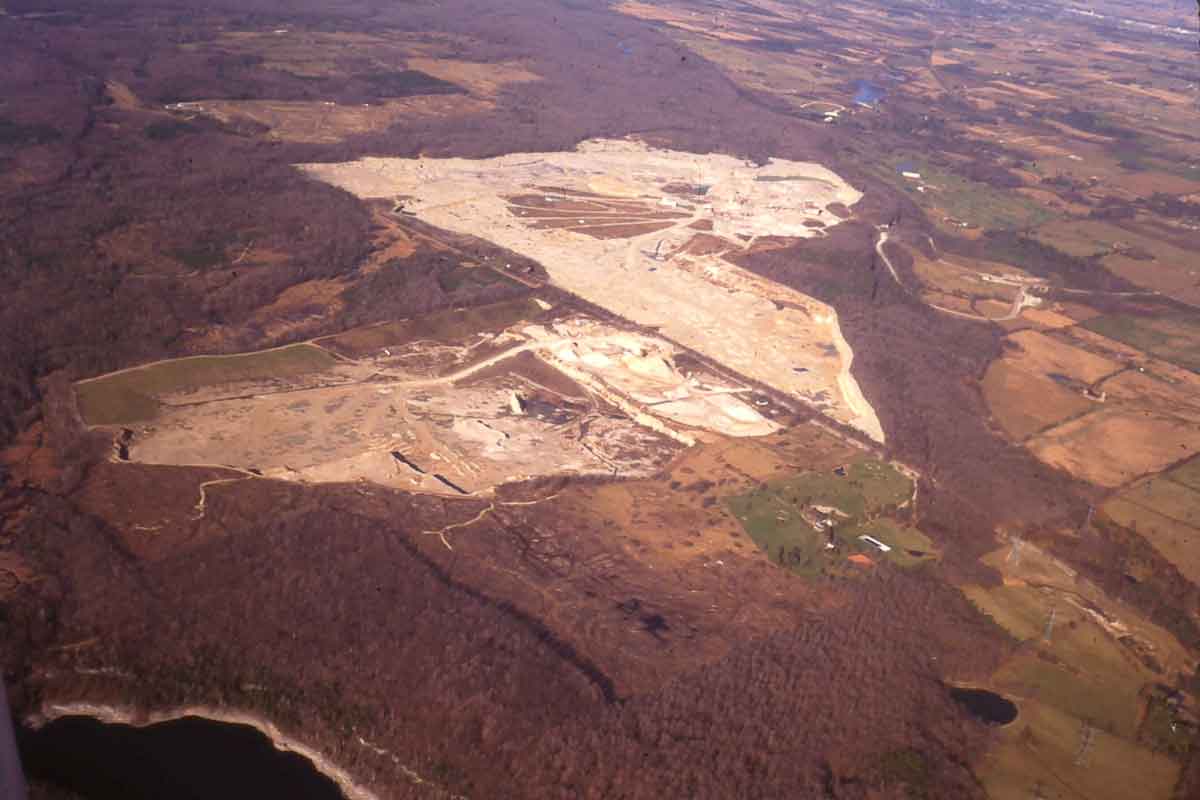
Much development is fortunately more subtle, or at least less obvious on the ground, than this. This Google Earth clip shows an area near Ballantrae with exurban development that is screened from the main road by trees. The photo on the right shows the huge limestone quarry on the Niagara Escarpment just north of Highway 401, from which it appears as a small cut in the face of the scarp.
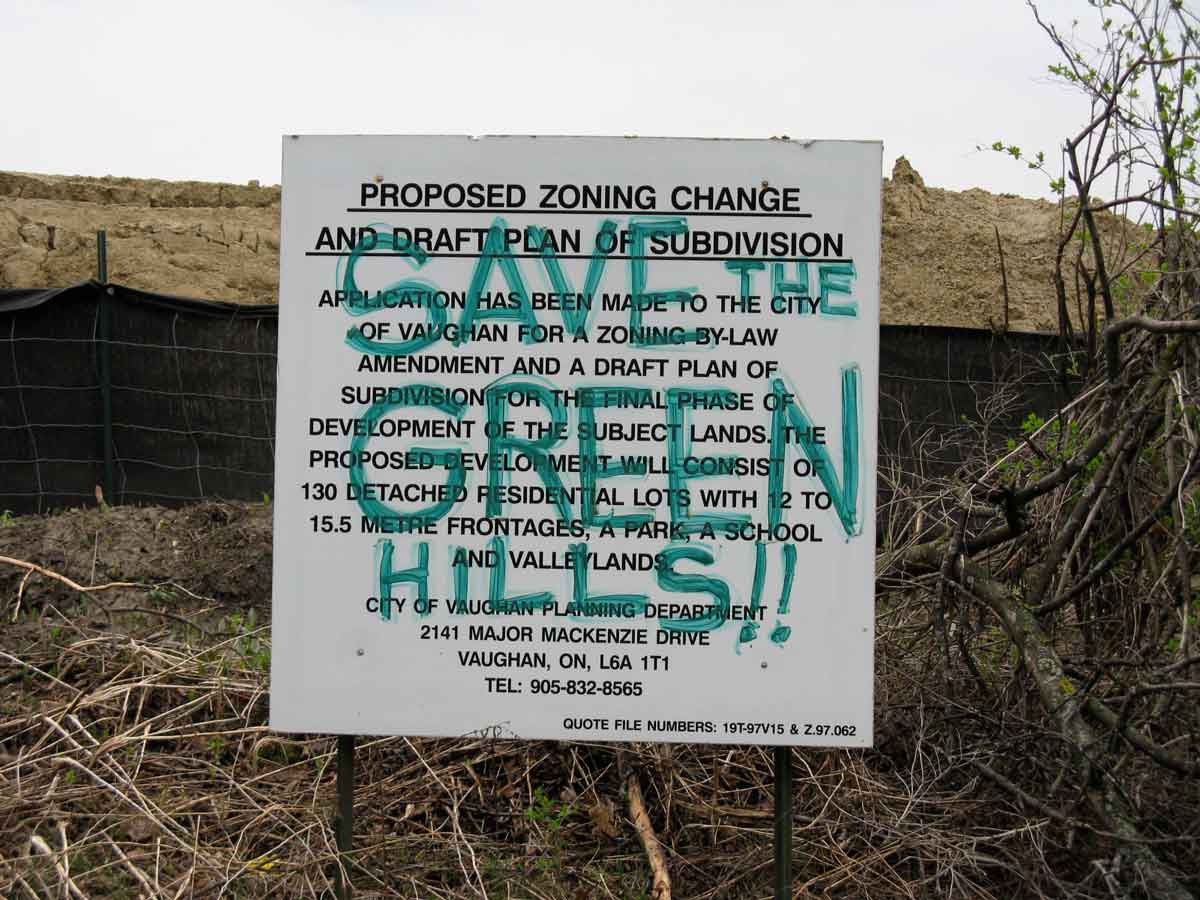
And here is one of the maps of the precise boundary of the Greenbelt (at Yonge Street in Richmond Hill) that shows residential development on either side of the line. On the right a despairing sign in Vaughan, near Kortright Conservation Area, about 2000 – in the background are piles of earth that have already been moved to make way for new development.
I do not doubt the importance of the Greenbelt, and the need to protect environmentally sensitive areas from large scale urban development. But my point is that there is often a large gap between the claims and what you actually see after you pass the signs telling you that you are entering the Greenbelt. This is clearly a contested area in spite of the legislation and the plan to protect it, which is presumably why the Friends of the Greenbelt takes a forceful approach to promote and defend the Greenbelt.
The Growth Plan for the Greater Golden Horseshoe
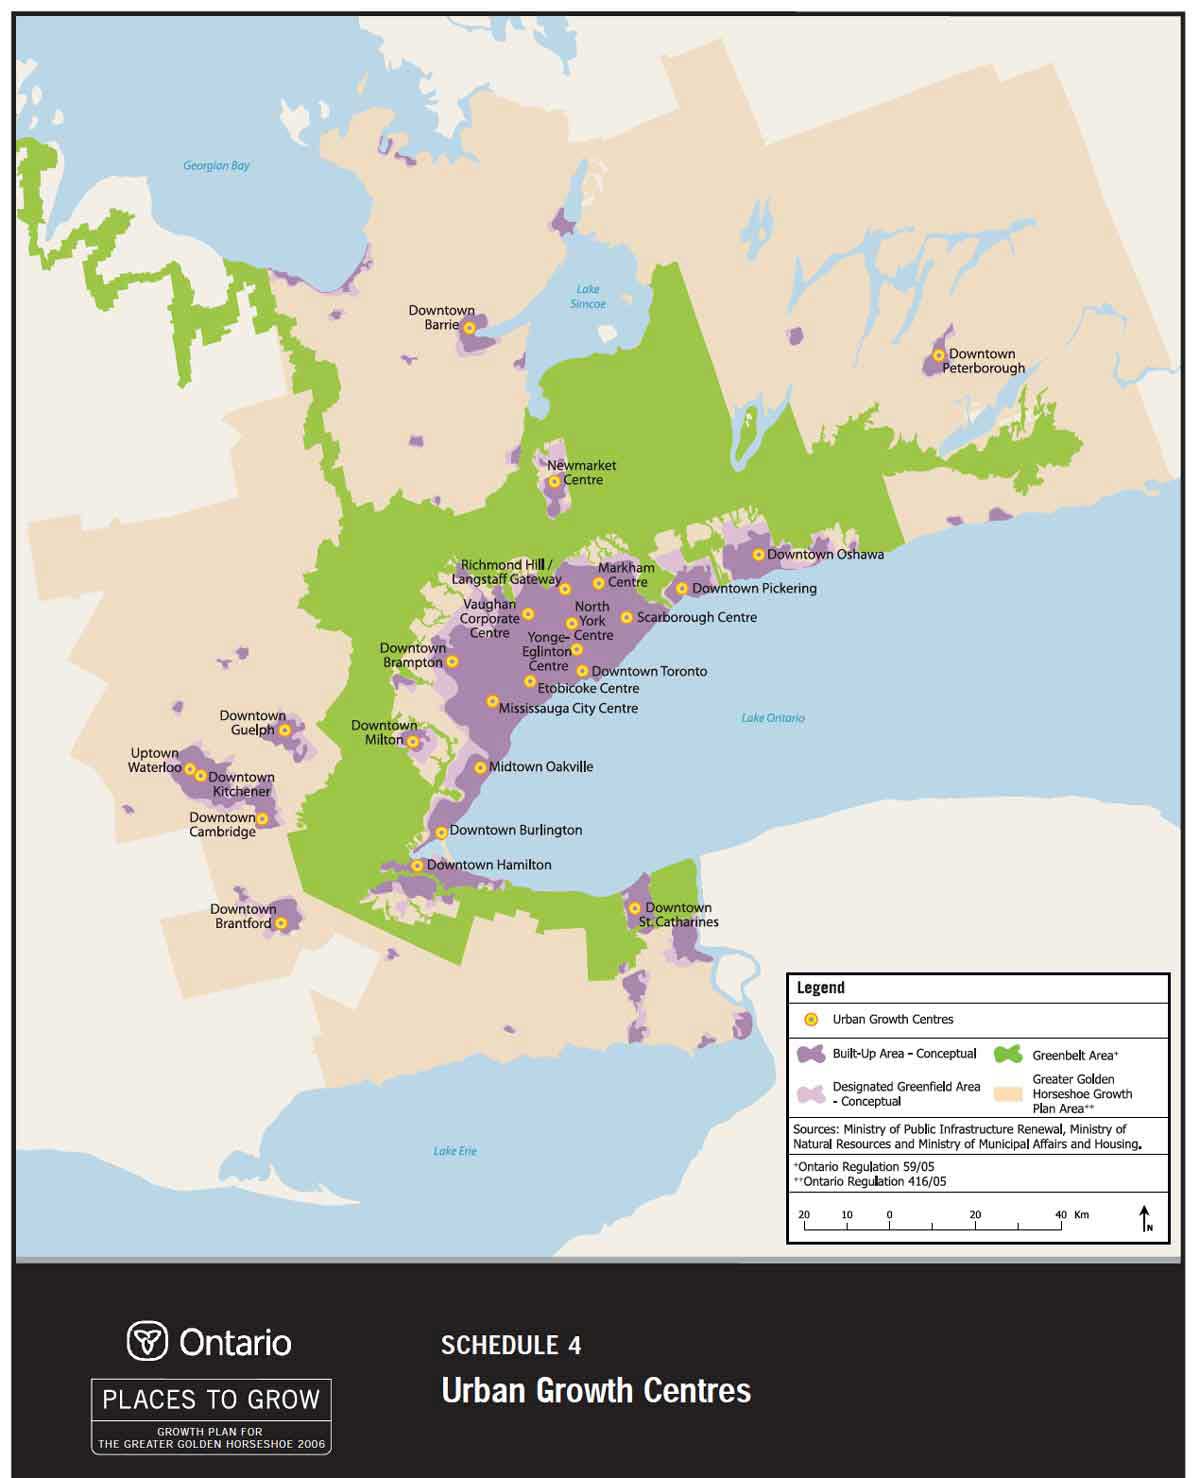
Here’s the key map from the Places to Grow Growth Plan, the plan that, given the constraint for spatial expansion imposed by the Greenbelt, aims to intensify existing built-up areas. This identifies the 25 proposed growth centres. It also shows the Greater Golden Horseshoe, a name invented for the Growth Plan but essentially the same as the Smart Growth Central Ontario area illustrated above in this web entry. The core idea is to intensify existing areas and to allow for growth in centres beyond the Greenbelt. The award of the American Planning Association for the Growth Plan is noted here.
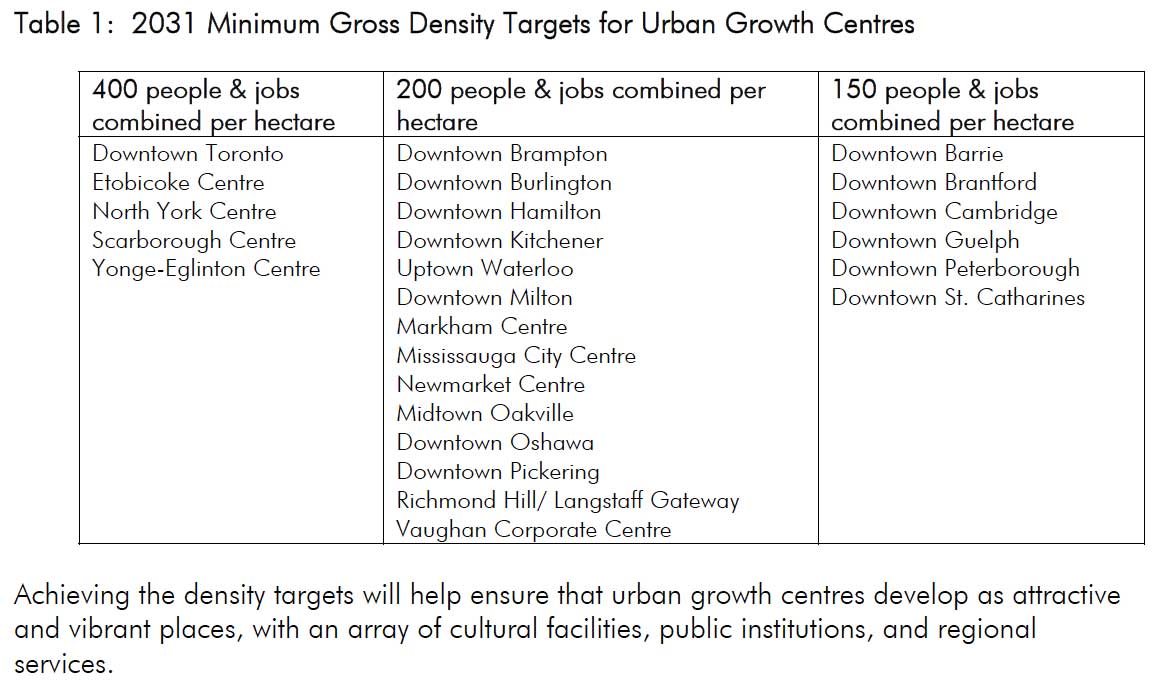
The important content of the Growth Plan is in the density targets. The table belowshows the innovative combination of people and jobs in density targets for the urban growth centres. All the 400/ha centres are in the City of Toronto. The Richmond Hill/Langstaff Gateway is the only centre that is not a current focus so the plan builds on existing urban forms and aims to push them further.
The aims of the Growth Plan are a bold attempt to contain urban expansion. This is the link to the Neptis commentary on the 2004 discussion paper issued by the province that I mention in Chapter 9. A more recent report for Neptis, Implementing the Growth Plan by Rian Allen and Phillipa Campsie, published since I completed my book, suggests that the realities of urban growth in the Toronto region remain a long way behind those aims. It suggests that the target of having a minimum of 40% of all new residential development occurring annually must be within existing built-up areas is not being achieved by most municipalities, and that there have been few changes in relatively low density development practices. The authors see a particular problem in the Outer Ring (the area of the GGH outside the Greater Toronto and Hamilton Area, and really the part beyond the Greenbelt), where high levels of urbanization are forecast but there are few well developed transit systems and it seems probable that urban development will have the low-density, car-oriented forms that the Growth Plan aims to reduce.
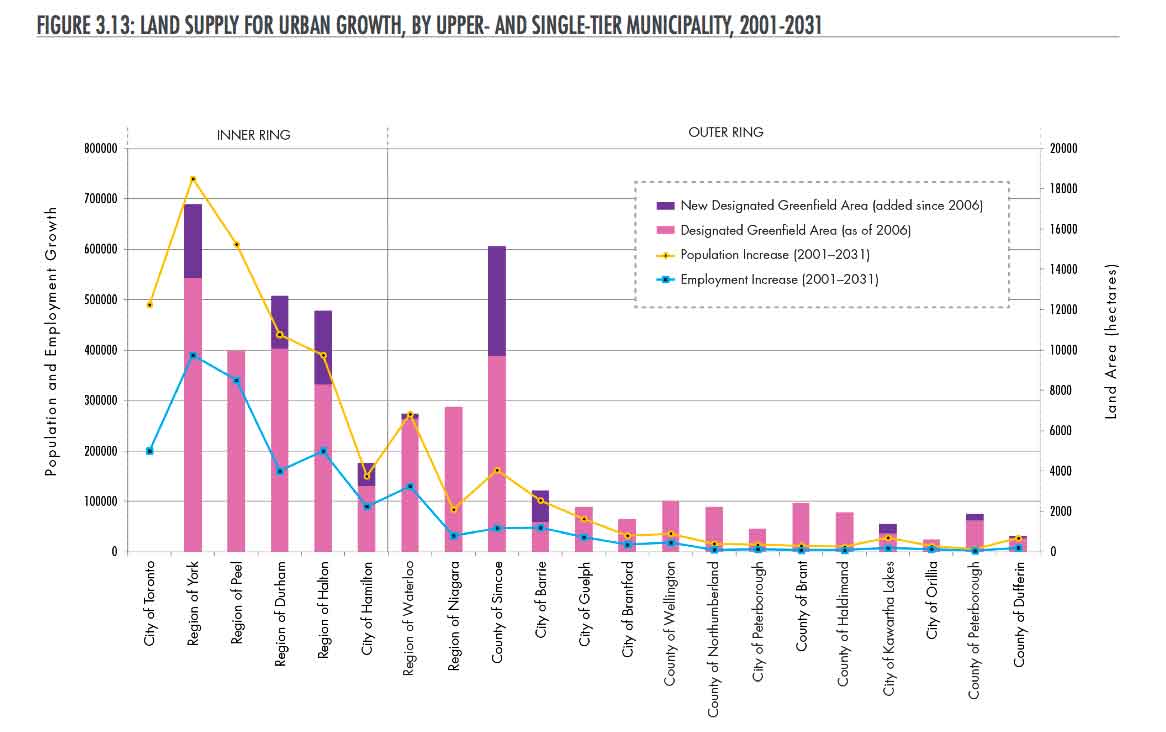
This diagram from their report shows the increase in greenfield (farmland) allocations by several municipalities since the Growth Plan was implemented in 2006 (the purple part of the bar). The County of Simcoe is the area around Barrie, immediately north of the Greenbelt and linked to Toronto by Highway 400.
The Big Move
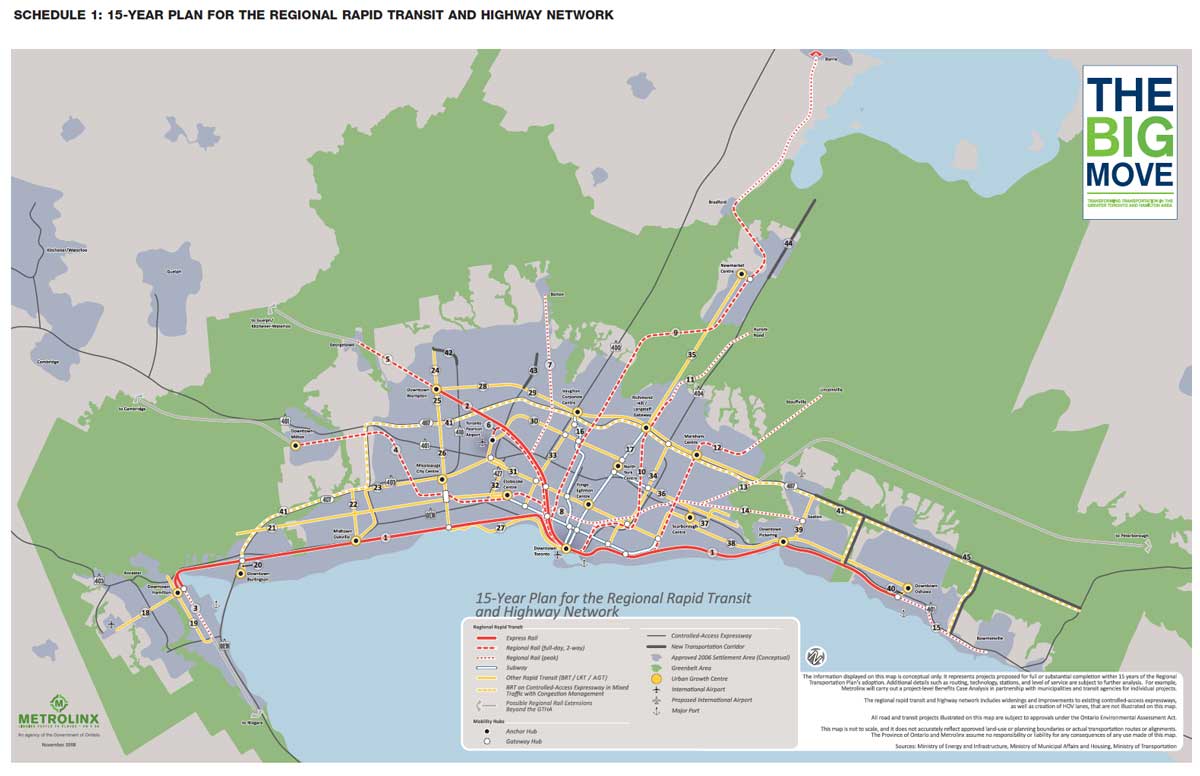
The third part of the regional plans is called The Big Move and is for transportation. Technically it is only for the Greater Toronto and Hamilton Area, but in practice Metrolinx, the government agency charged with implementing it is also responsible for GO transit which has routes throughout the GGH. This map shows the 15 year plan – there is another for the 25 year plan. It is interesting because it, like the overall plan, emphasizes transit – red lines are rail, yellow line are bus and light rail rapid transit, and expressways are the thin grey lines in the background.
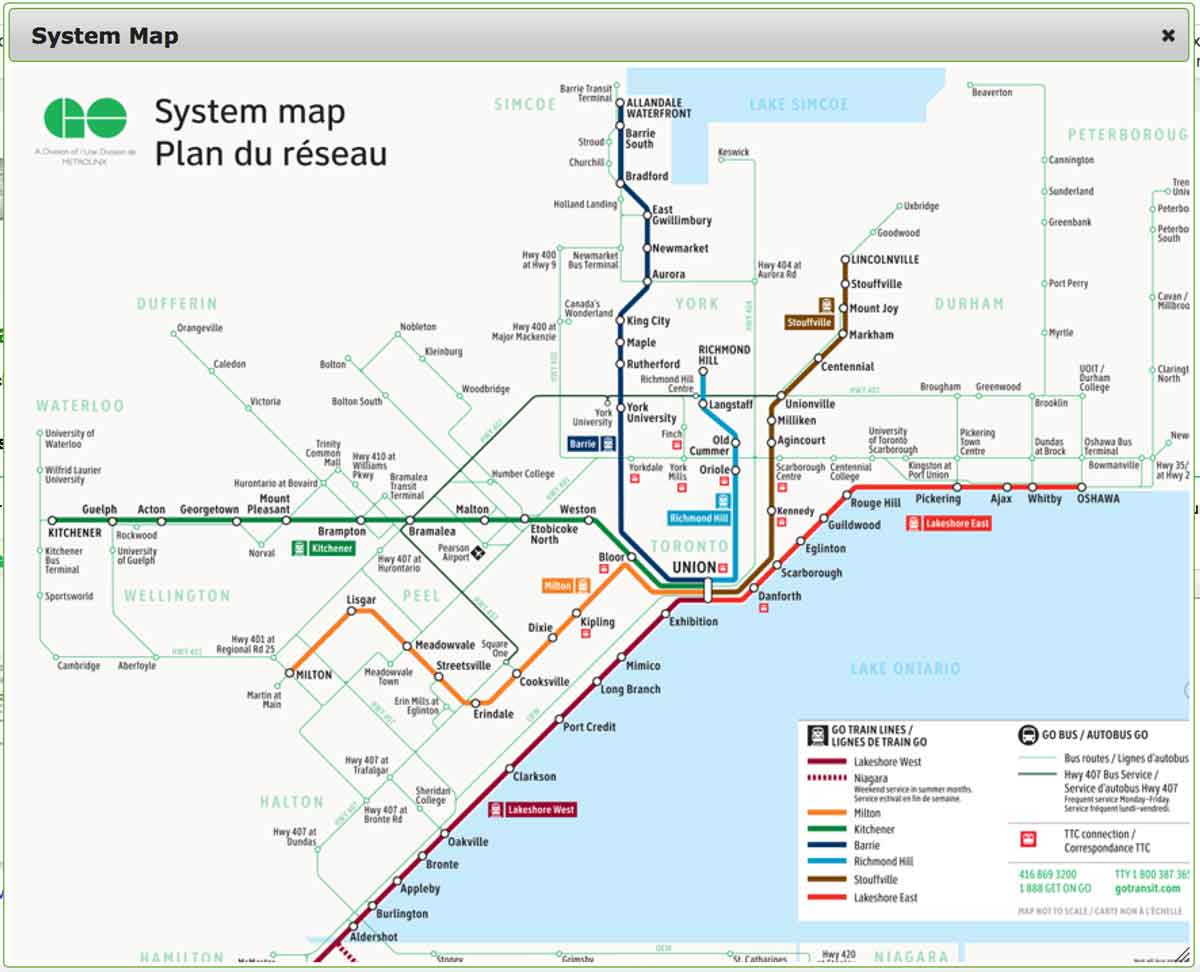
Below is the current cartogram map of the GO system, which reaches from Niagara Falls to Barrie, Peterborough to Kitchener.
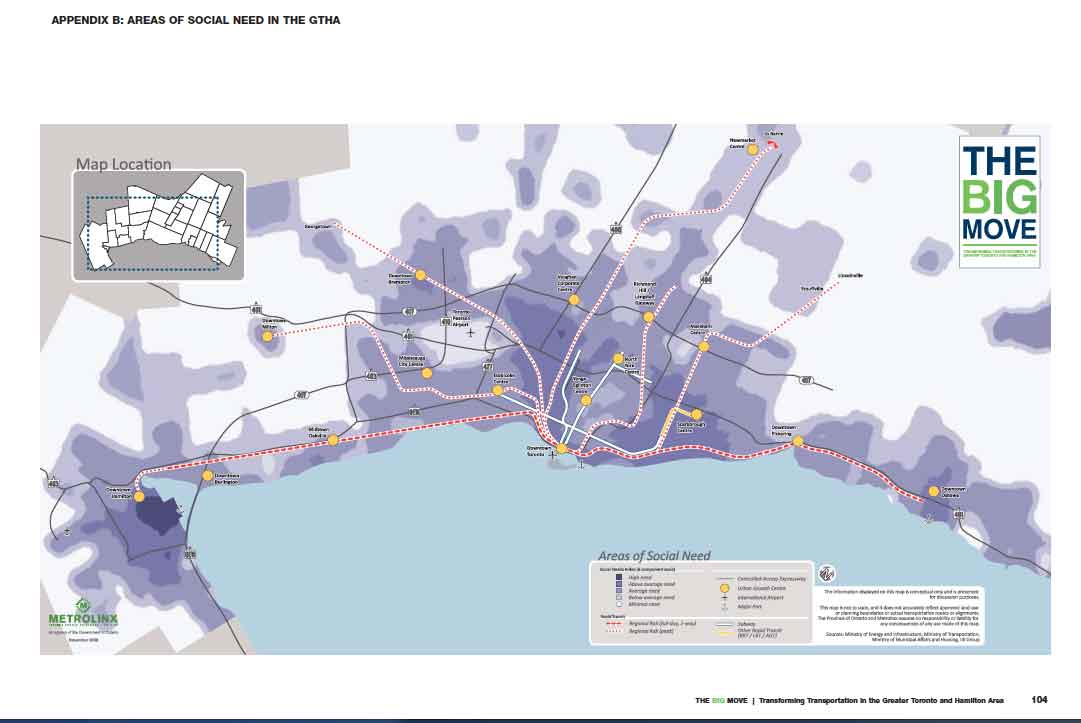
The Big Move is the only one of the three plans that addresses broad environmental and social issues. The emphasis on transit is clearly connected to concerns about pollution and climate change. Below is the map in the plan showing areas of high social need – which are considered to be the areas that most warrant rapid transit. I don’t know the methodology used to generate this, but it is nevertheless of note because the highest need areas, shown in the darkest shades, are in East Hamilton not in the City of Toronto.
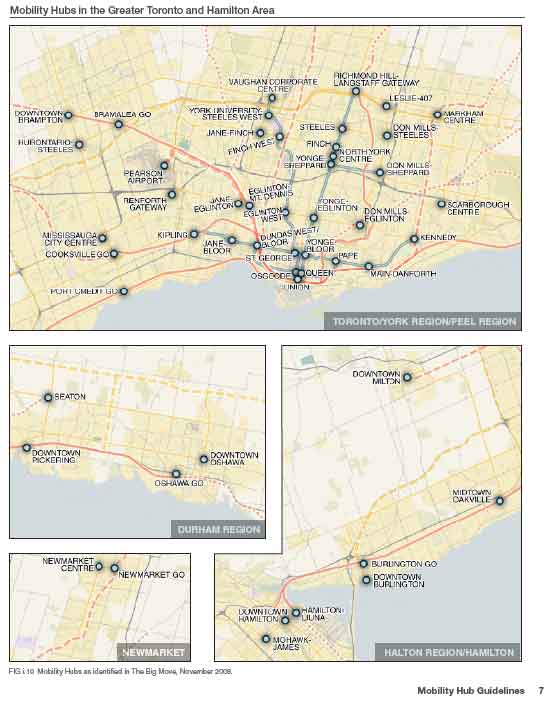
The main aim of The Big Move is presumably to support The Growth Plan by encouraging intensification in centres and along transit corridors. In addition the urban growth centres, which are shown as yellow dots on the maps, it identifies various mobility hubs, mostly transit interchange points. So while Hamilton is a single urban growth centre, it has three mobility hubs. In the City of Toronto many of the proposed mobility hubs are at subway stations.
 And
And
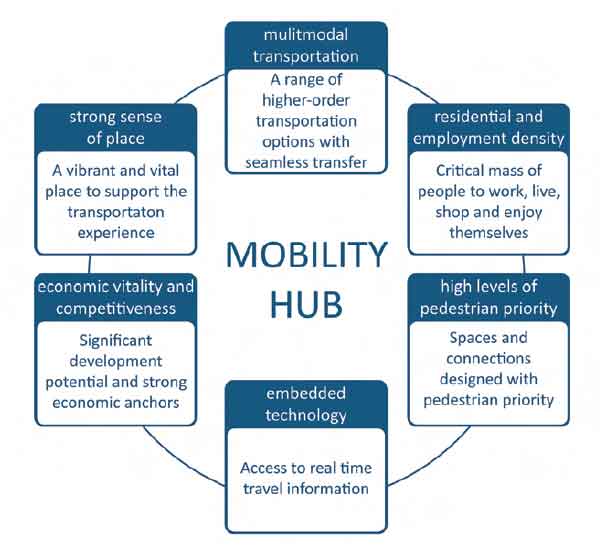
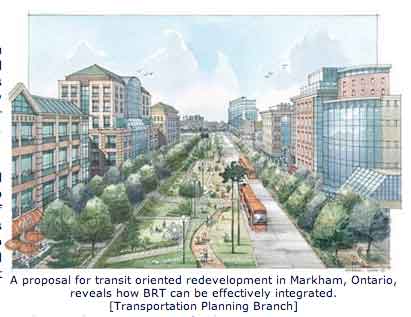
And here are the theory and imagined realization of mobility hubs from various publications by Metrolinx. The rendering is of Markham Downtown.
Other Plans with Regional Implications
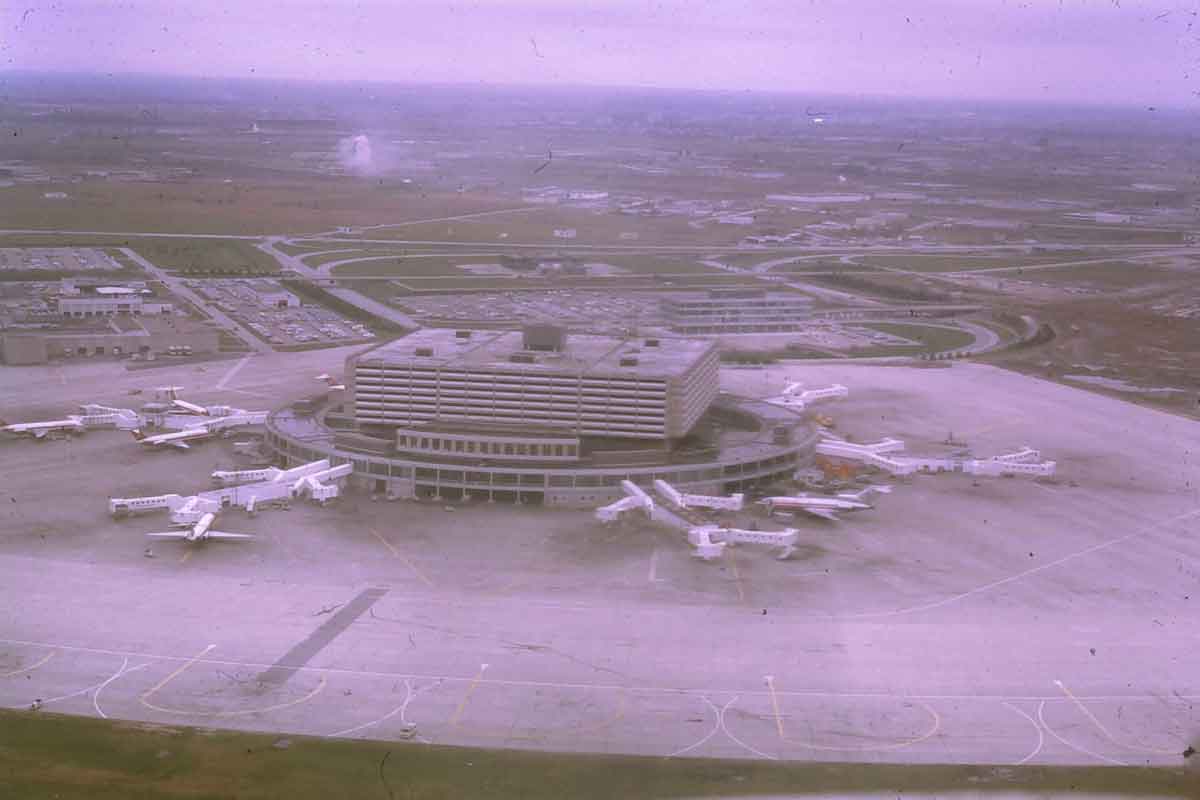
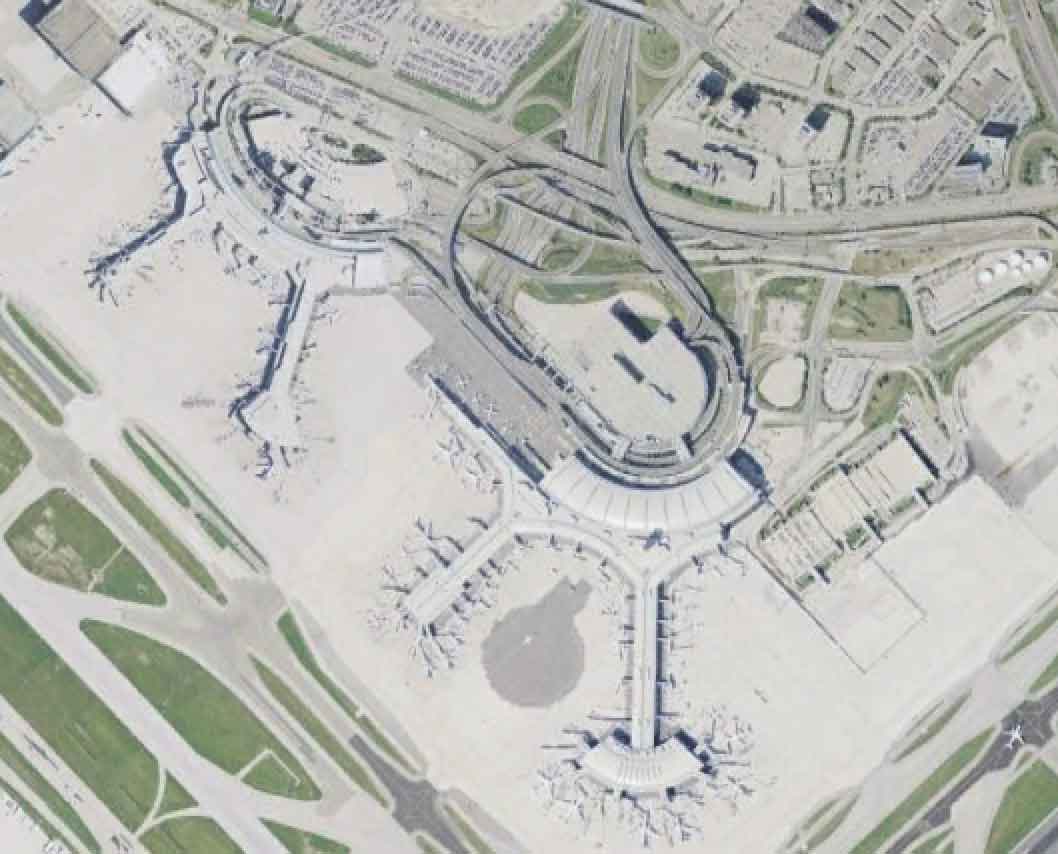
The Greenbelt, the Growth Plan and the Big Move together comprise a remarkable attempt to manage urban regional growth and change. But they have some substantial omissions. For instance, while The Big Move does identify Pearson Airport as an anchor mobility hub, and if you look carefully at it maps it does show other airport locations, it does not grapple with the regional consequences of growth in air traffic and changes to airports, presumably because airports are a federal responsibility. Consider the change just to terminals in the last 40 years. The photo on the left I took in 1970, and shows then brand new Terminal One at Pearson with about 20 gates; on the right is a recent clip from Google Earth – Terminal One has long gone, replaced by two new ones with four spiny extensions, each with more capacity than the demolished terminal.
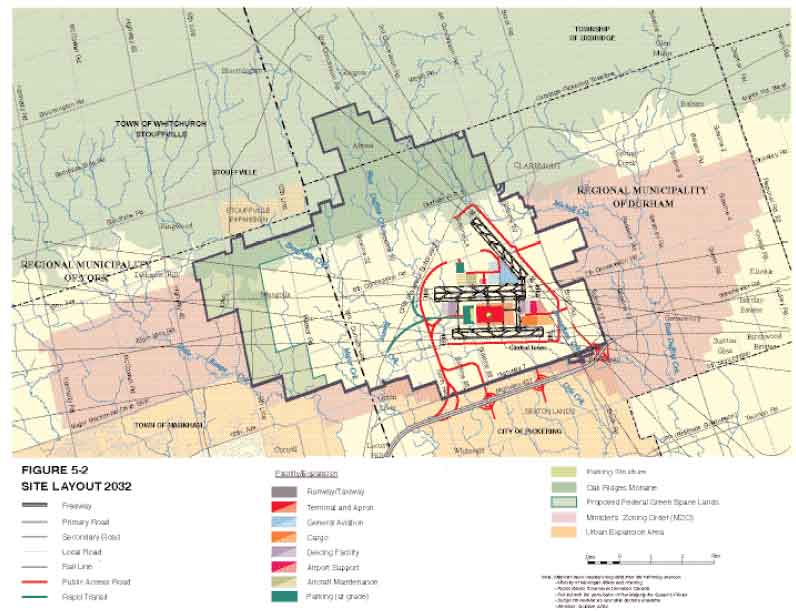
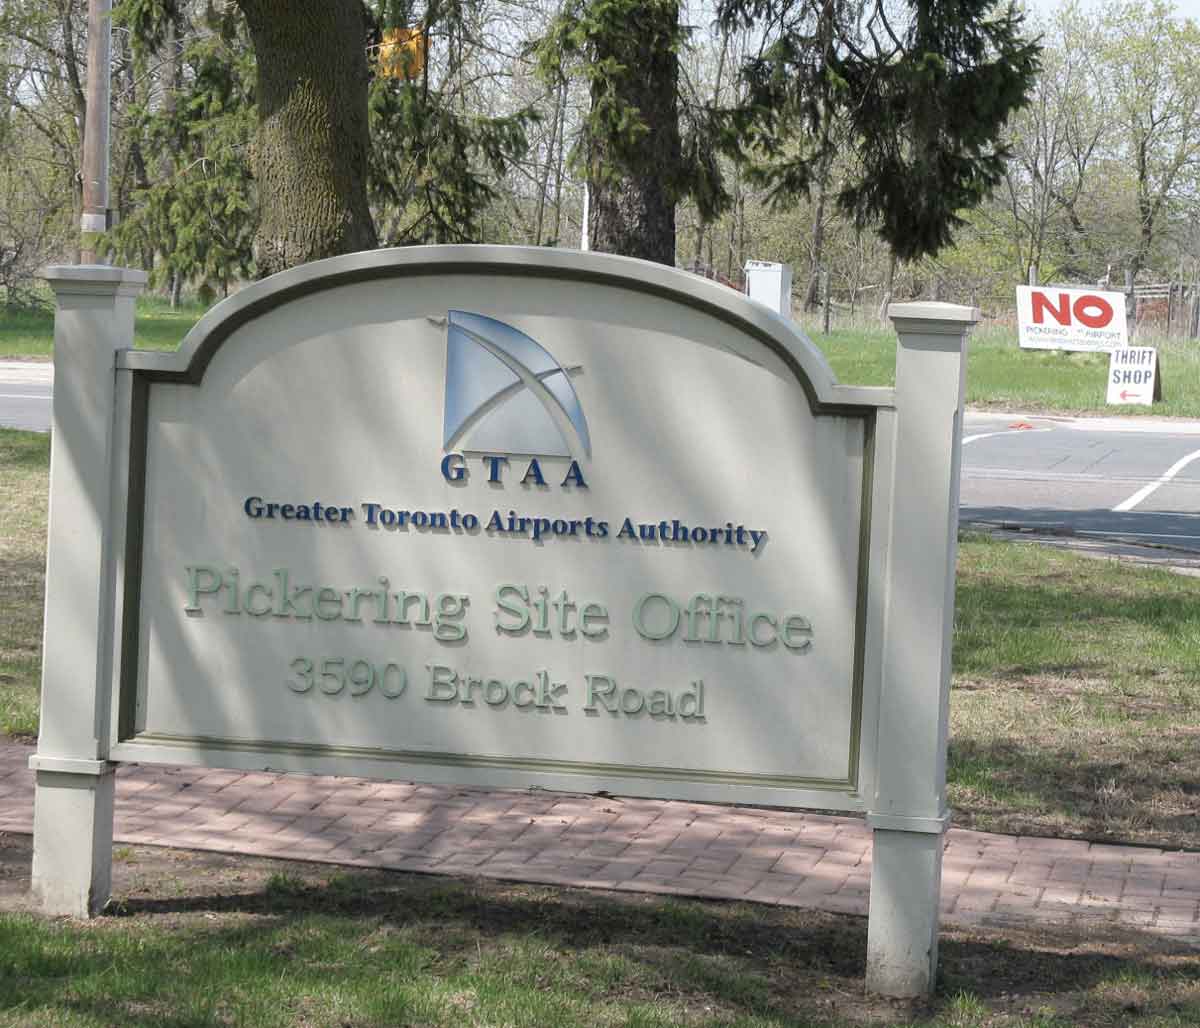
I write in Chapter 9 that the master plan for Pearson Airport (published in 2007 for the period up to 2030 by the Greater Toronto Airports Authority, the agency responsible for managing and planning air transportation in the region) argues that Pearson will begin to run out of capacity as soon as 2017 and traffic will have to be moved to other airports in the region. Circumspectly, the federal government expropriated land in Pickering in the 1970s in the event that another airport would be needed. This possibility has been dormant for about 30 years, but the GTAA has detailed plans for the Pickering Airport, shown on the left below) and maintains a small planning office nearby. The NO (airport) sign in the background is an indicator of the opposition that will arise when the airport become more than a possibility.
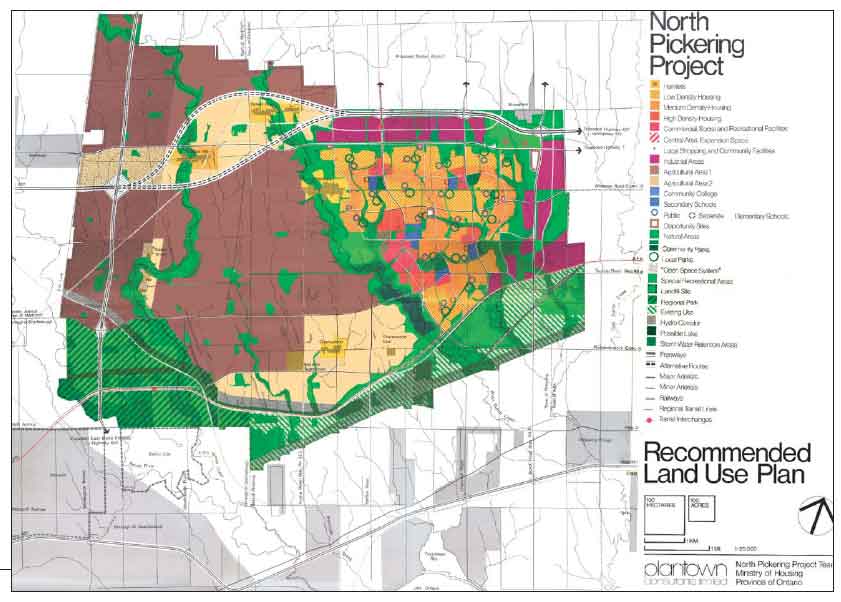
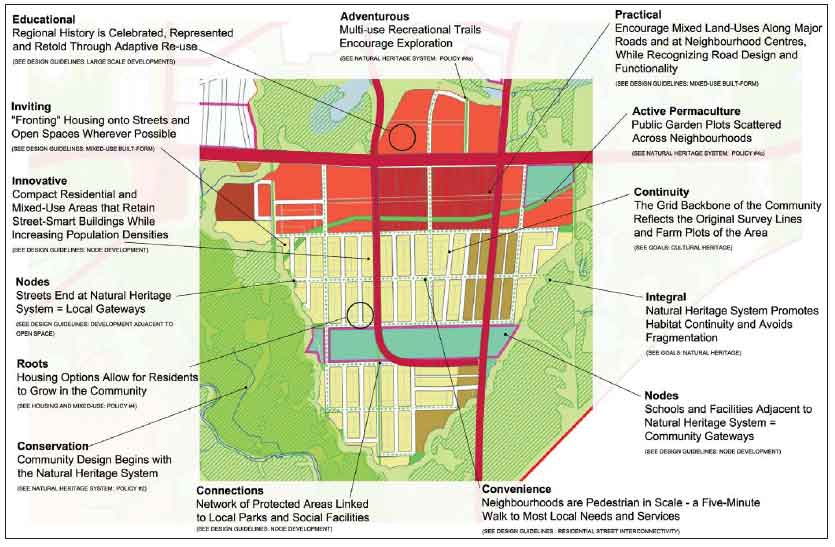
I also write about the fact that adjacent to Pickering Airport the province has long planned for a new town, now called Seaton, also on expropriated land. In the 1970s it was thought that this might have a population of 200,000, but this target has been drastically scaled back and current plans are for an environmentally friendly town of about 30,000. It is shown on the maps of The Big Move (above) as a mobility hub. Here are some key elements in the plan for Seaton from the Central Pickering Development Plan.
At present the lands for the Pickering Airport are on hold, in a state of limbo – this is a major reason why the City of Pickering has such low growth rates relative to other municipalities in the region.
Regional Initiatives and The Limitations of Current Regional Planning
In an intriguing initiative the GTAA, the Toronto and Region Conservation Authority, Mississauga, Brampton, Peel Region and the City of Toronto have begun to work on an environmental plan – “a business eco-zone” – called Partners in Project Green for Pearson Airport and the surrounding industrial area – the most heavily industrialized part of the Toronto region. This raises the fact that there is no environmental plan for the region (other than the Greenbelt, which is spatially limited and anti-urban). The Toronto and Region Conservation Authority, whose main mandate is the management of watersheds, does promote the idea of The Living City.
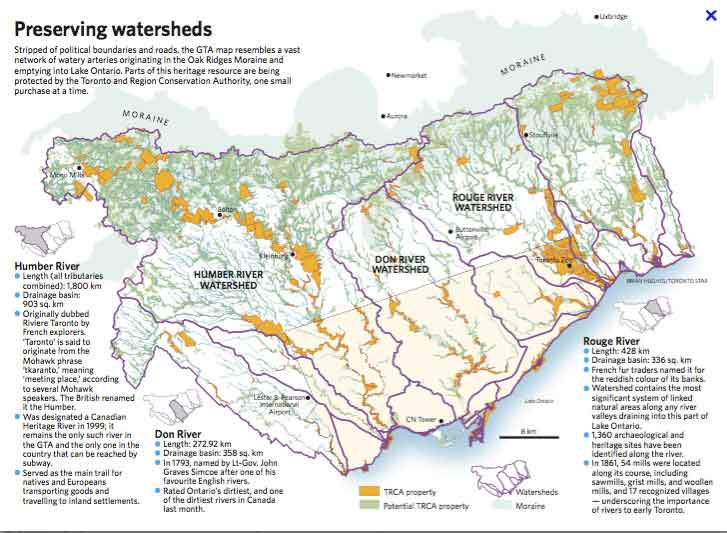
And since, as the map below (which I took from a website nicely named Bricoleur Urbanism and which in turn attributes it to the Toronto Star) shows, the TRCA owns large sections of the flood plains that run through the City of Toronto and it is in a position to implement some of its ideas about the living city.
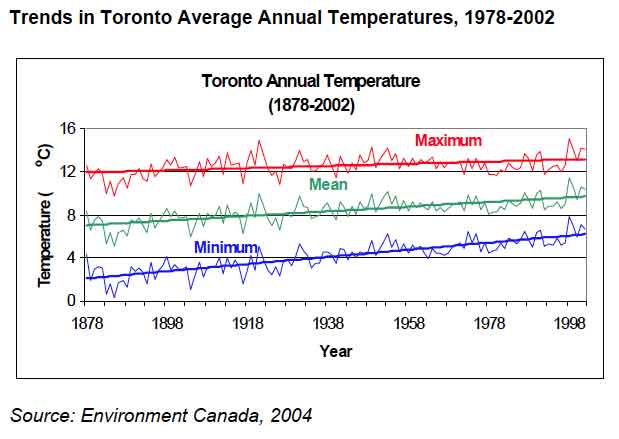
All municipalities in the region are taking some actions in response to changing climate, which the temperature graphs below from Environment Canada suggest is locally very apparent, and there are some attempts at coordinating these. [A description of the meeting in Toronto that marks the effective beginning of debates about global climate change is available here, and a summary of some of Ontario’s policies on climate change is available from the Ministry of Municipal Affairs and Housing here. The City of Toronto is a a member of the C40 Cities Leadership Climate Group – a network of world megacities taking action to reduce greenhouse gas emissions].
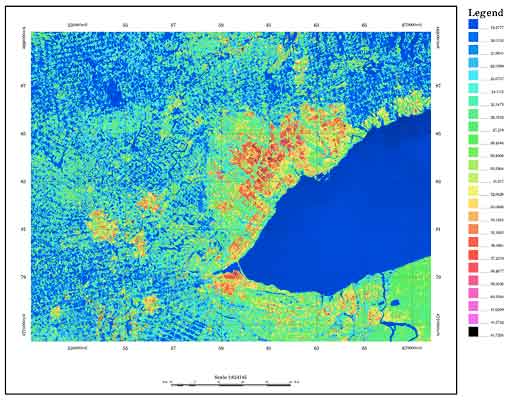
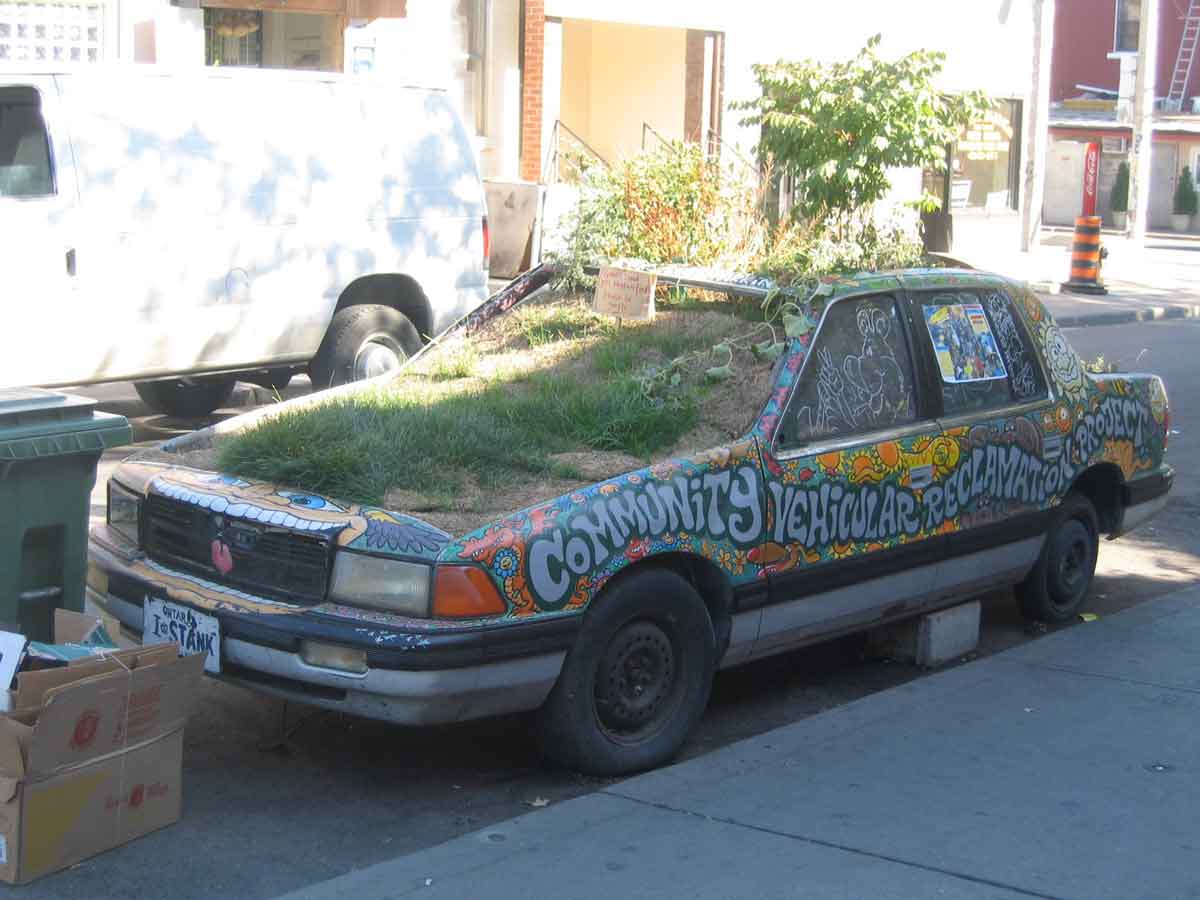
But, as is shown by these two illustrations, one a false image of the Toronto heat island, and the other a clever installation in Kensington Market, environmental issues are both regional and local, they are urban and rural, and they involve air, water, land, plants, and the uses to which all those are put in an urban region. Sound plans and policies need to recognize these complex interactions and there is nothing that does this for the region as a whole.
 .
.
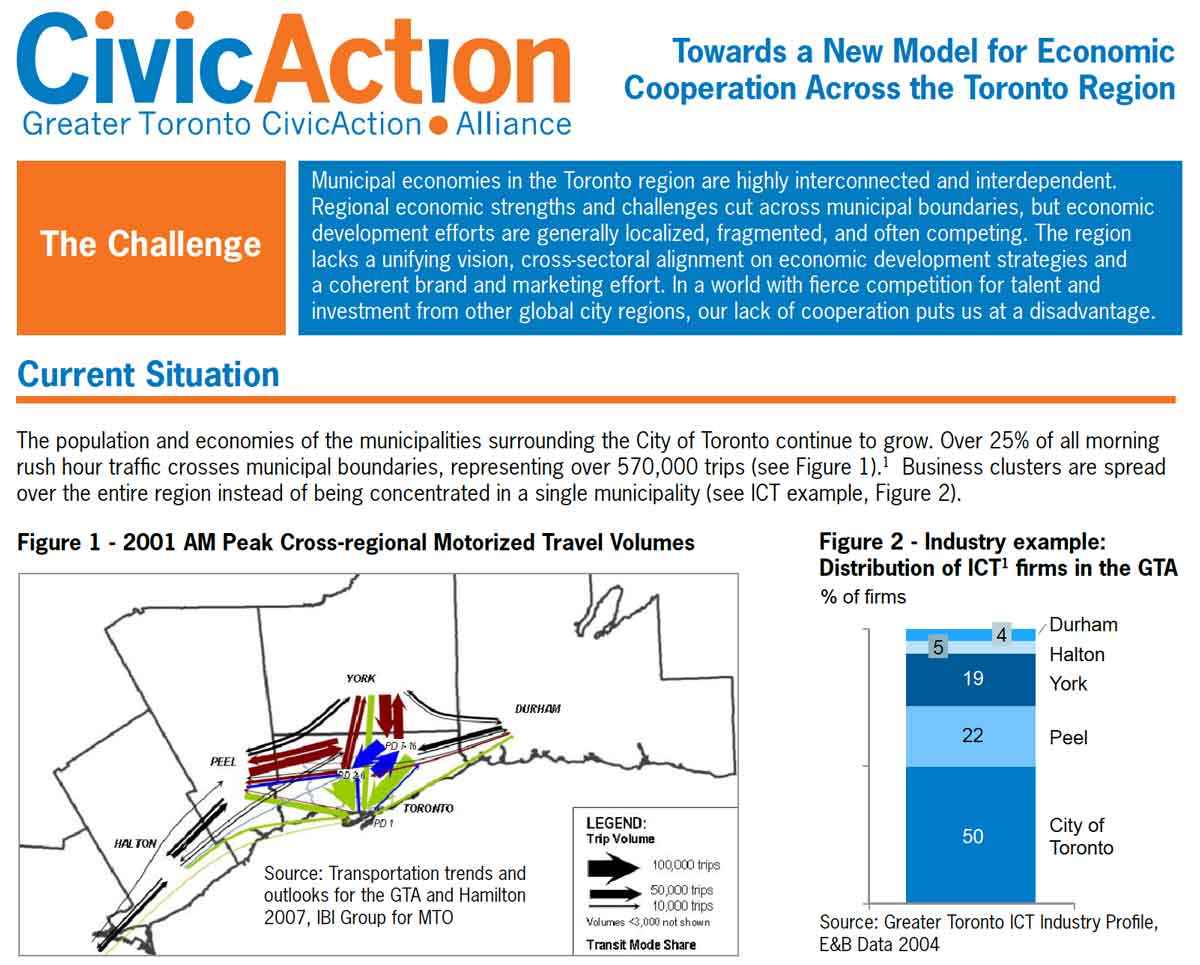
Similarly, there are no overarching economic or social plans that parallel the ones for constraining and intensifying growth. Civic Action is attempting to fill some of these gaps, for instance in this call for regional cooperation, but it has to deal both with municipal fragmentation and with the divided responsibilities within municipalities for addressing economic, environmental and development issues. In other words, the Greenbelt, the Growth Plan and the Big Move can provide no more than partial answers for managing the complexities of a metropolitan region.
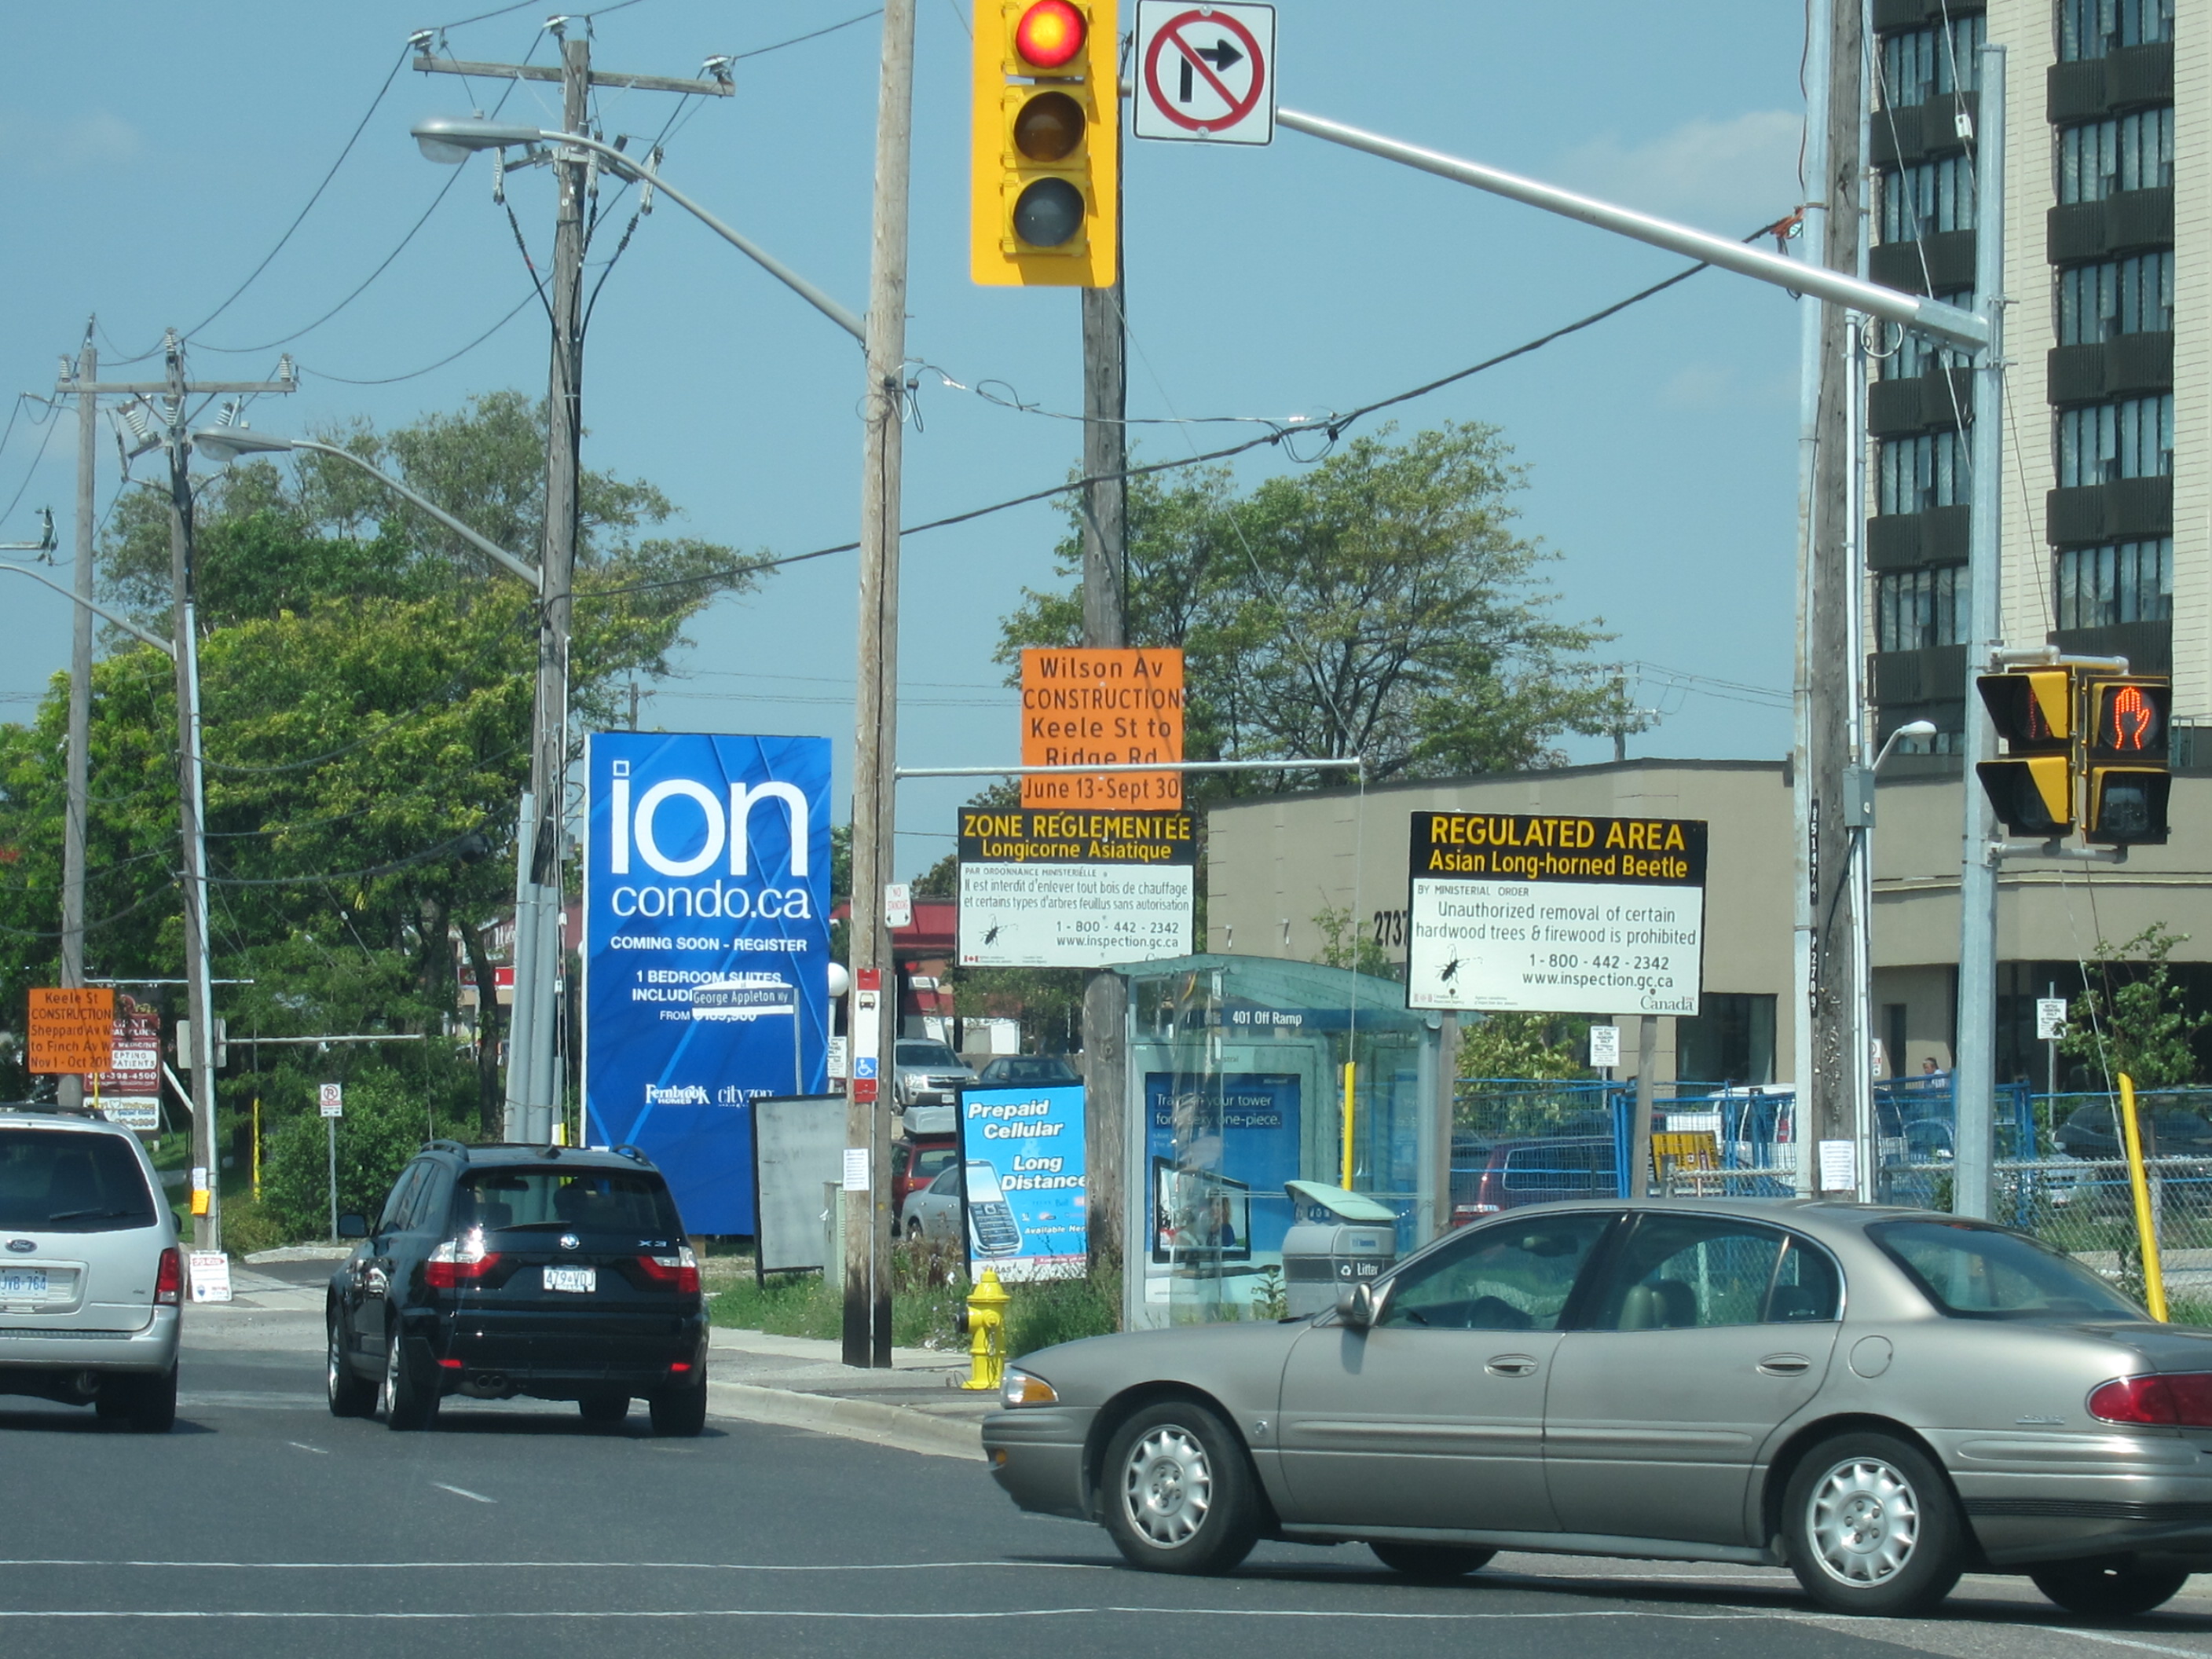 The inadequacy of current regional planning strategies is revealed especially when it comes to handling problems that have an international dimension. These signs about Asian long-horned beetles, mostly in the north-west part of the metropolitan area, reveal a sort of geographical irony in that they are trying to set local boundaries for a pest that was imported, probably in palettes shipped with goods from Asia. As an international traveler the beetle presumably neither knows nor cares about those boundaries.
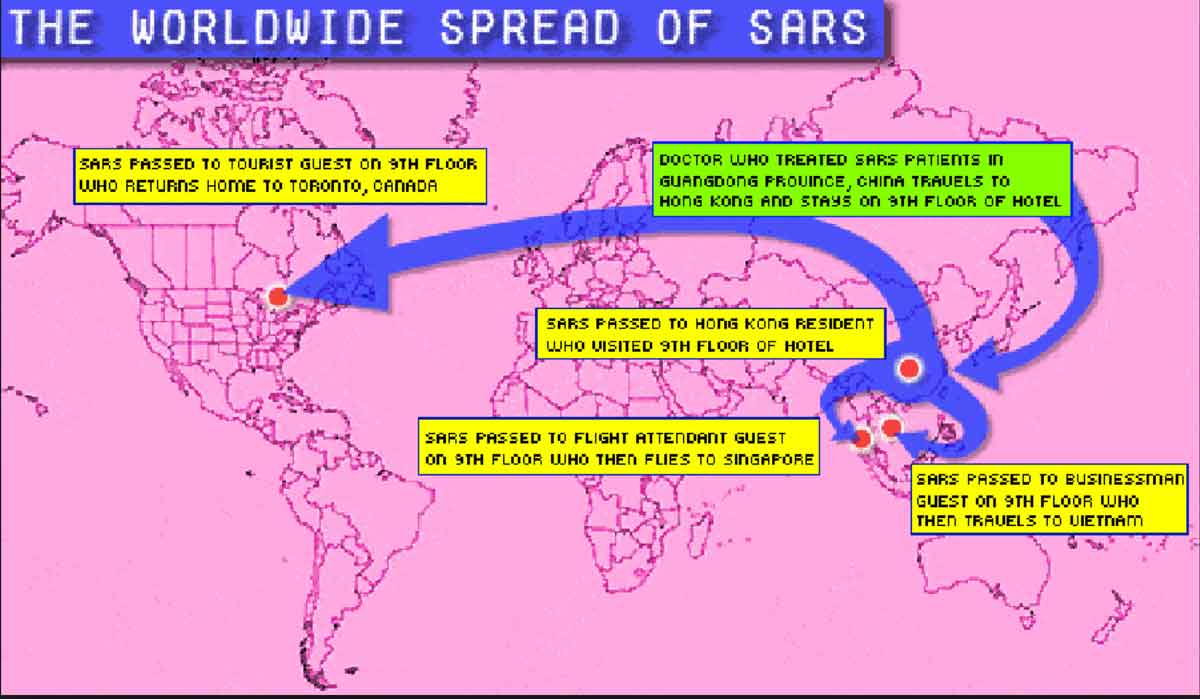
I write at the end of Chapter 9 that Toronto became a case study for the difficulties of handling international processes that manifest themselves locally with the SARS epidemic of 2003. The fact that it did not handle it well led to a very thorough public enquiry called The Spring of Fear that identifed confused relations between municipal, provincial and federal governments and the fact that health workers and citizens cross political boundaries even if health record do not.
This diagram (apparently from a class presentation at Cedarcrest Academy in Allentown, PA) summarizes how the virus got to Toronto. SARS serves as a metaphor for and warning about all global processes – whether medical, economic, social, political or environmental. The old, localized ways of planning, no matter how impressive they may be, are no longer enough.