 This page is part of the companion website to my book Toronto: Transformations in a City and its Region, published by UPenn Press.
Preamble: The way industry was
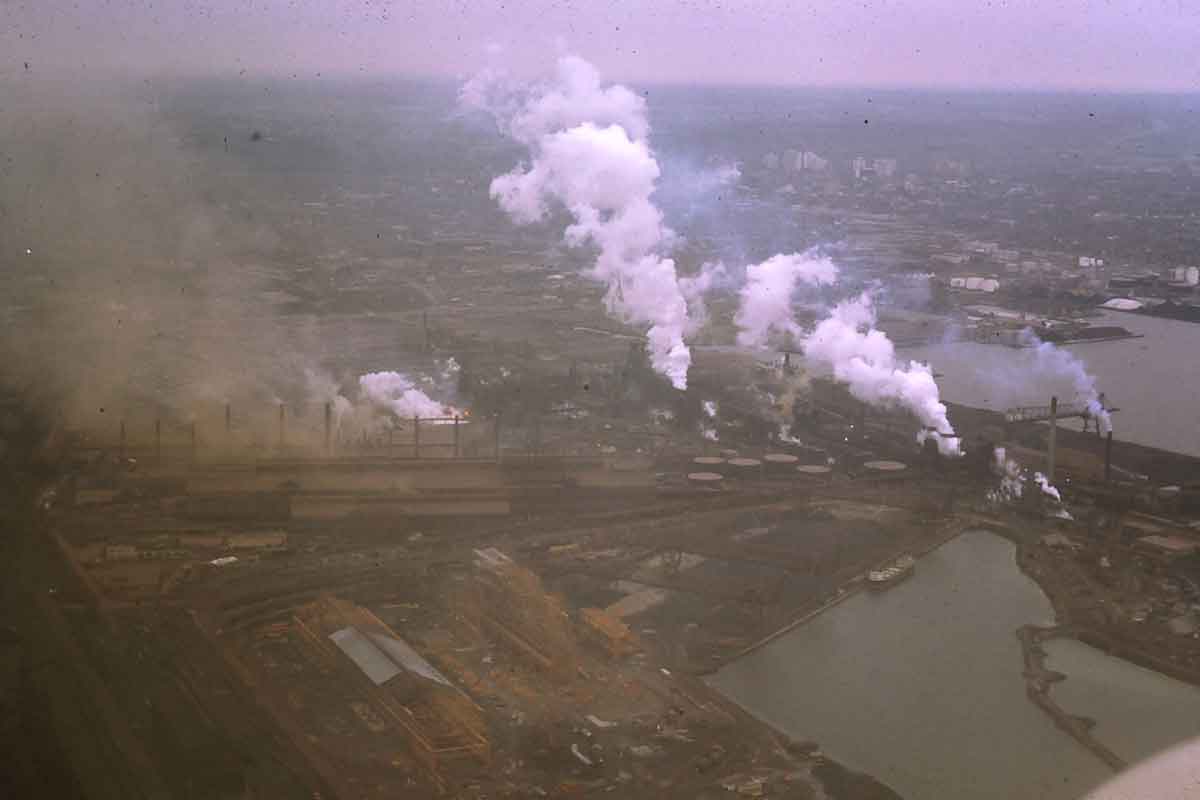
Until the 1970s the economic base of the Toronto region was primarily manufacturing industry. Since then the progress of deindustrialization has been relentless and most old factories, especially in the old City of Toronto and the rest of Metro, have closed and been demolished or converted to other uses. The last major survivor in the region was the former Stelco Steel Plant in Hamilton, here shown in a photo I took about 1970 that conveys the grimy character of old industry. In late October 2013 it was announced that this plant, now operating with substantially less pollution and owned by United States Steel Co, will be shut down at the end of the year.
Economic globalization and Toronto in the Global Economy
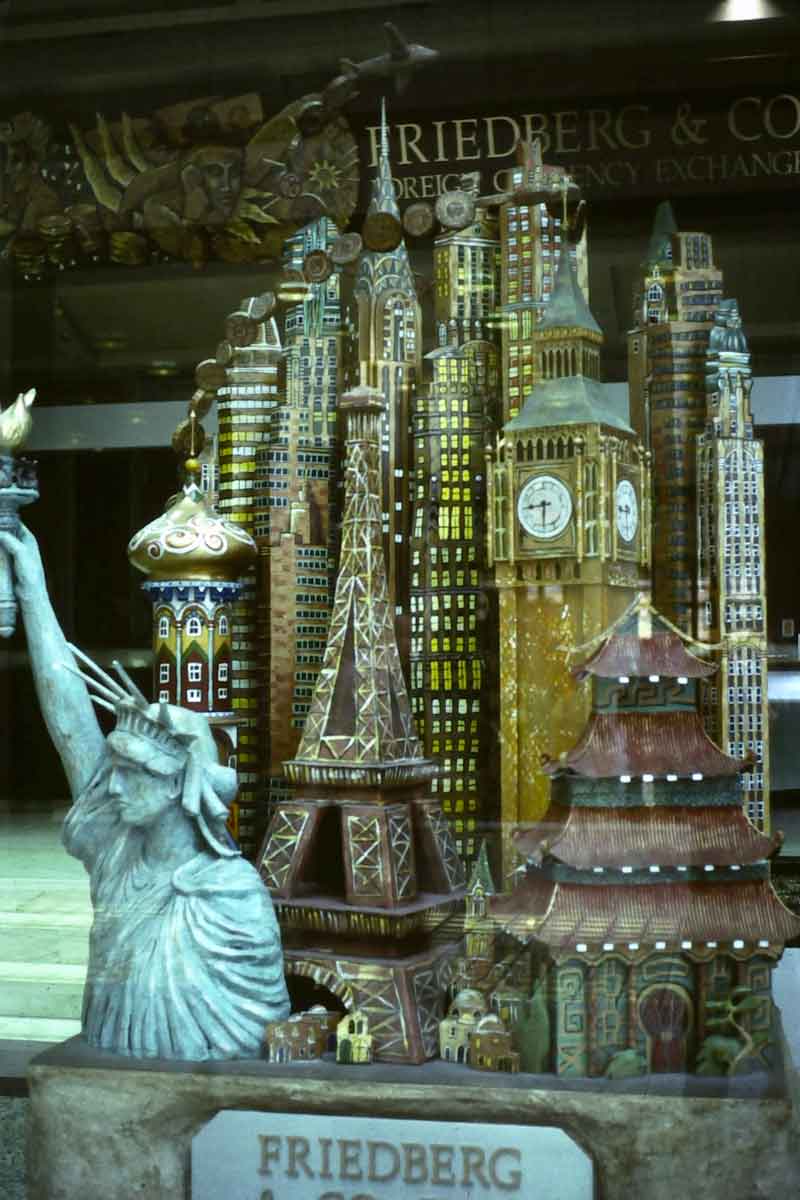

Economic globalization was an aspect of the region even before Toronto was founded in 1793 because it was caught up in the trade of beaver skins to Europe to make fashionable fur hats. The industrial and urban growth of the city in the late 19th century was associated with exporting both resources and manufactured goods such as agricultural equipment. With the decline of manufacturing Toronto’s role in the global economy has been mostly to do with finance. Evidence of this can be discerned in various ways in the urban landscape. These photos offer two examples. The skyline of many cities above on the left is a nice metaphor for the space-time compression of global capitalism; it was the window display in a foreign currency trading exchange in BCE Place in the financial district for several years (I took this photo about 2005). Tehranto Trade is a store sign in North York that captures a fusion of two cities and cultures.
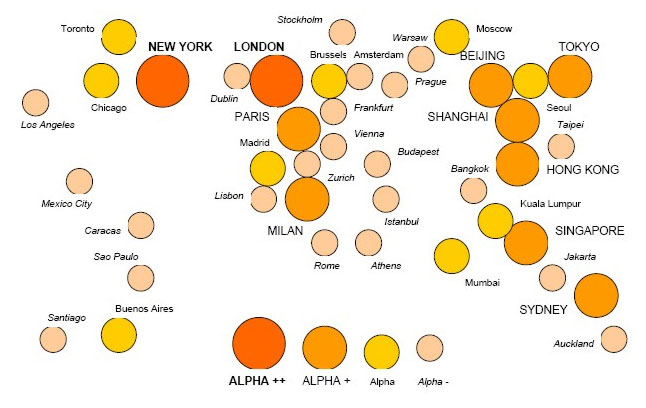
The cartographic diagram below is taken from the Globalization and World Cities website. This is a research group based at the University of Loughborough in the UK, and it shows a 2010 assessment of Toronto as an Alpha City in relation to other Alpha and Alpha+ global cities that have been ranked on the basis of their economic interaction. Most global cities serve as economic gateways for their nations and have greater economic interactions with each other than they do with cities in their nations.
One important aspect of economic globalization is an apparent obsession with comparative measurements of various economic and other attributes of world cities – economic opportunity, cost of living, innovation and whatever else can be measured. These rankings often seem to be very clear (Toronto usually ranks somewhere between 2nd and 20th) but they are problematic, as Zack Taylor has pointed out in “Lies, Damned Lies and Statistics: A Critical Examination of City Ranking Studies”, not least because their methodologies, no matter how meticulous, tend to serve specific goals. Apart from anything else they are part of neo-liberal agenda that has infused a lot of urban thinking and practice, for instance in this sign announcing the adoption by the Town of Ajax of ISO 9001 standards.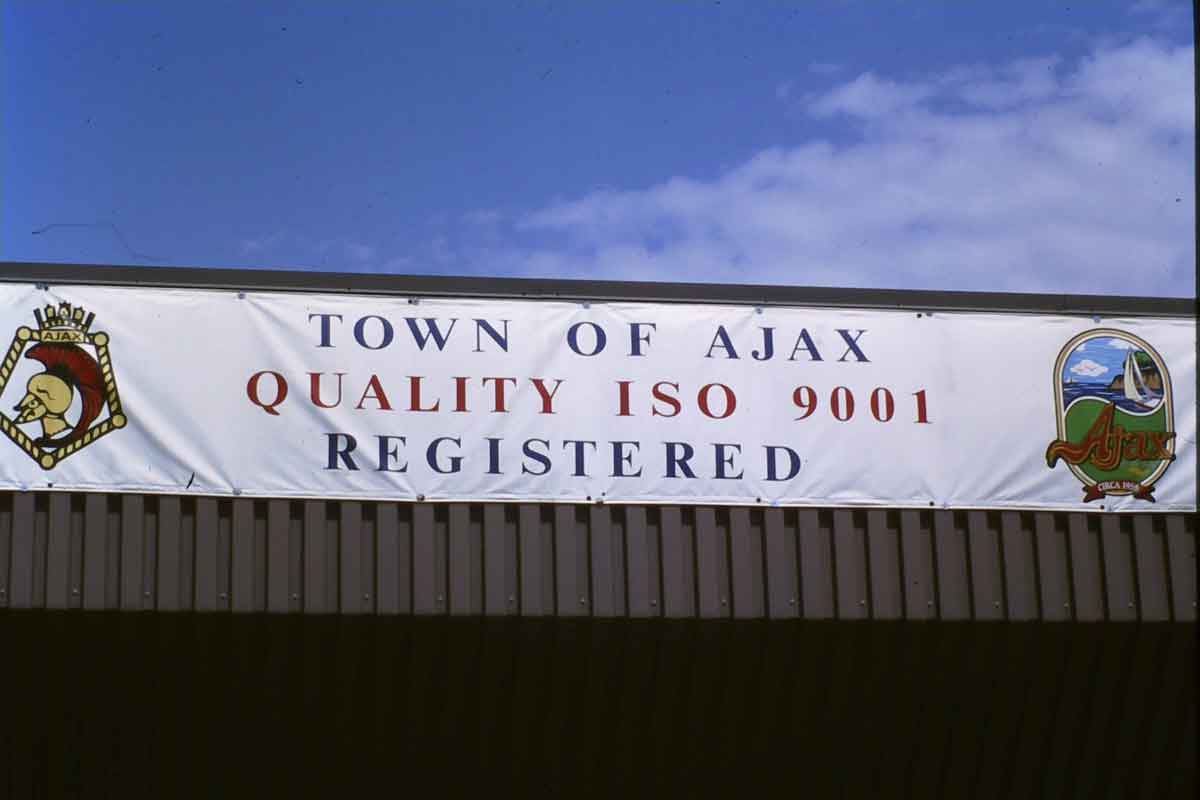
The source for the quote from Price Waterhouse Coopers near the beginning of Chapter 8 about Toronto as a village of the globe is Cities of the Future: Global Competition, Local Leadership, 2010. Sources for global rankings include the City of Toronto website, Brookings/LSE, Mercer, FDI Intelligence. The Hibernia Global Financial Network illustration is from Hibernia’s website.
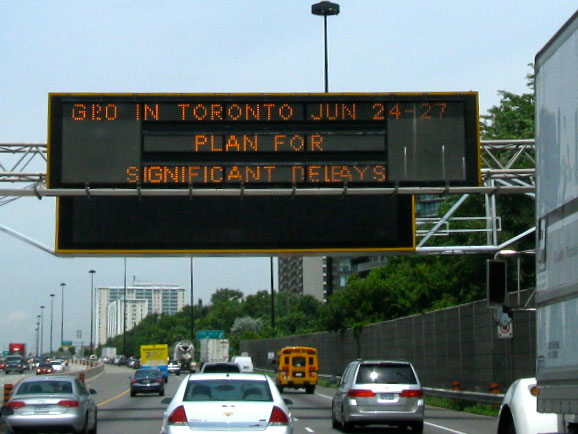
A testament to Toronto’s global economic role came in 2010 when it was the host city for the G8 and G20 meetings. This sign on the Don Valley Parkway gave an indication of the aggravation it caused, but far more serious was that it led to the temporary suspension of civil liberties in the name of security in the area of the city where the meetings took place. This seems now to be regarded as an unfortunate but necessary consequence of neo-liberal economic strategies, as indicated by the Economist article “Toronto the not-so-good” in June 2010 that described the protests against the G8/G20 meetings as “modest.” The local view is that part of Toronto was temporarily turned into a police state.
Toronto in North America’s Urban Economies
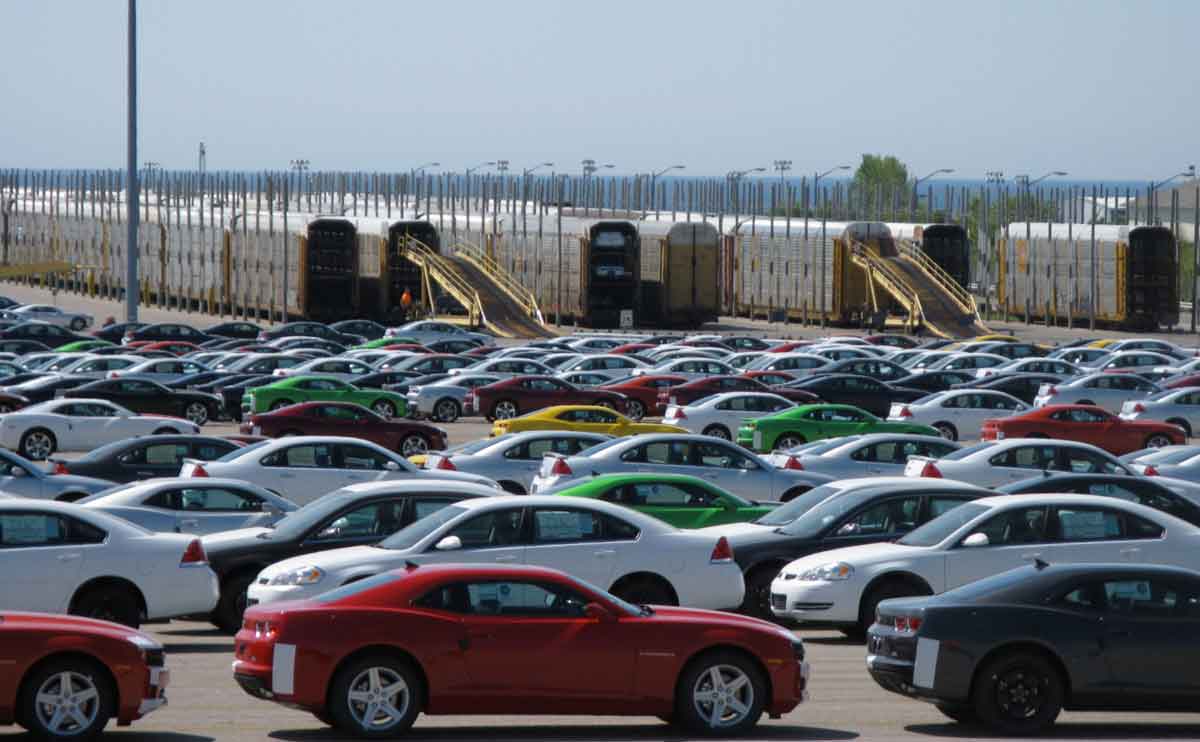
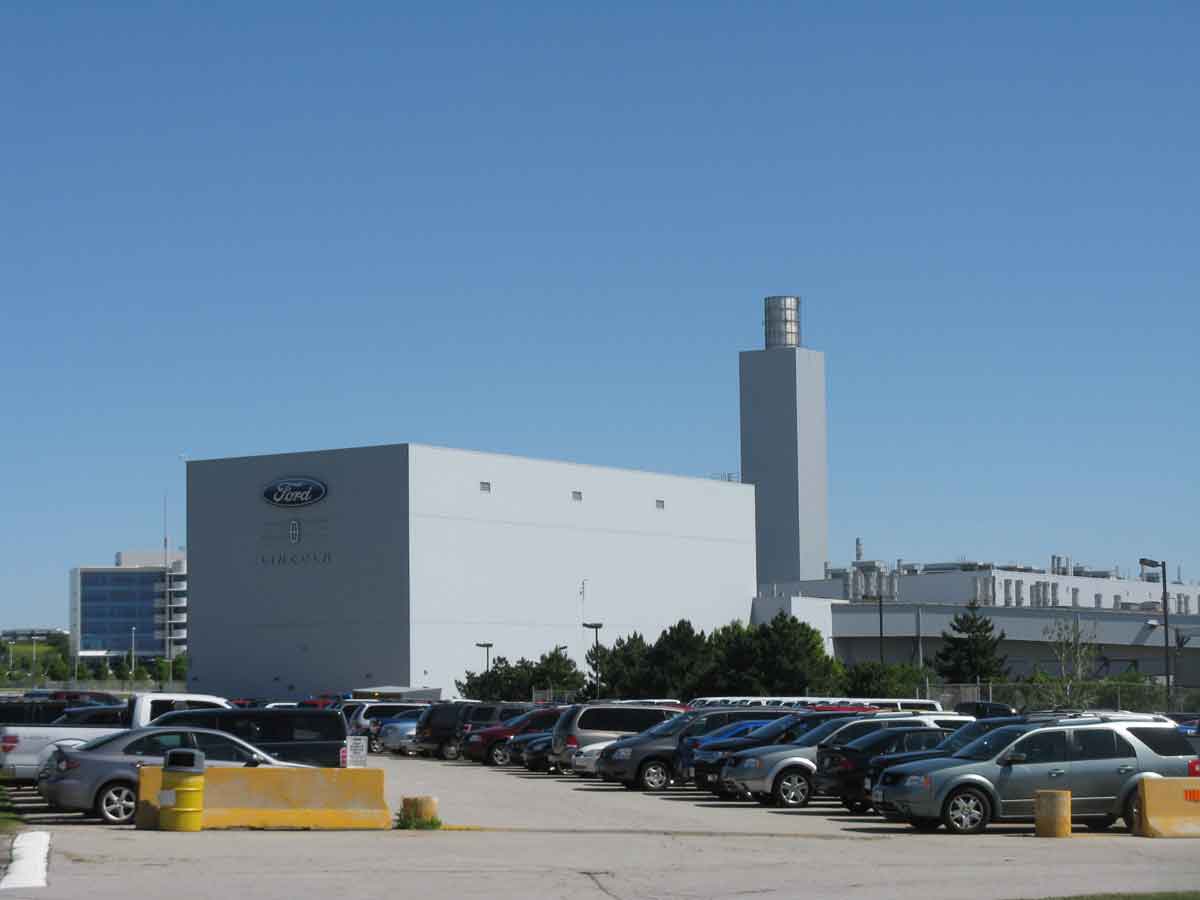
One hugely important element of economic activity in the region is the assembly of automobiles and trucks. Automobile manufacturing on a relatively small scale dates from the early 20th century, but it received a huge boost from the 1965 Auto Pact between Canada and the US that removed tariffs between the two countries on automobiles and led to substantial increases in production in assembly plants in Oakville, Brampton and Oshawa. The Auto Pact was declared illegal by the WTO in 2001, but the assembly plants remain highly visible and important elements of the region’s economy. On the left above are cars waiting to be loaded onto rail carriers at the GM plant in Oshawa; on the right is the Ford Plant in Oakville. There is also a Chrysler facility in Brampton, and, a little further afield, a Toyota assembly plant in Cambridge and a Honda one in Alliston.
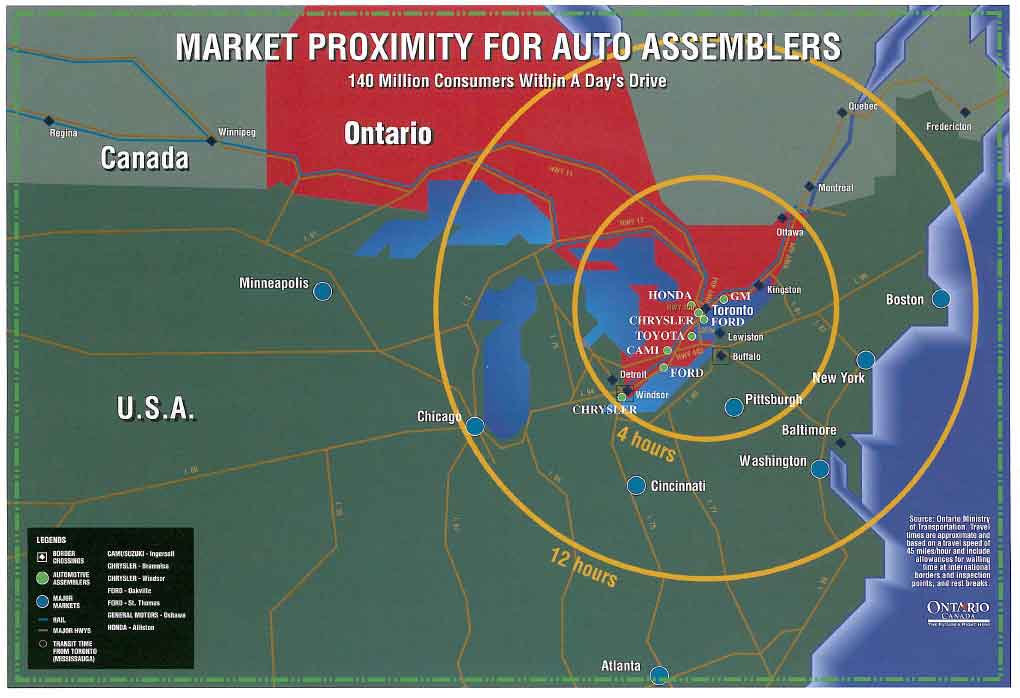 One aspect of the economic attractiveness of the Toronto region in North America lies in the fact that it is considered to be located within relatively close range of other manufacturing centres and an enormous potential market. This is something that is usually indicated with a map showing concentric circles of driving/flying time from Toronto that encompass both Chicago and New York. This map is specifically for the auto industry, but several economic development departments for municipalities in the Toronto region have used similar maps as part of their self-promotion to attract businesses and investment. These maps tend to be generous in their estimates of a day’s drive or an hours flying time (they do not include getting to the airports and waiting for flights), but I have driven west from Toronto across the continent several times and my impression is that trucks with Ontario plates are not uncommon as far as Chicago but unusual beyond there.
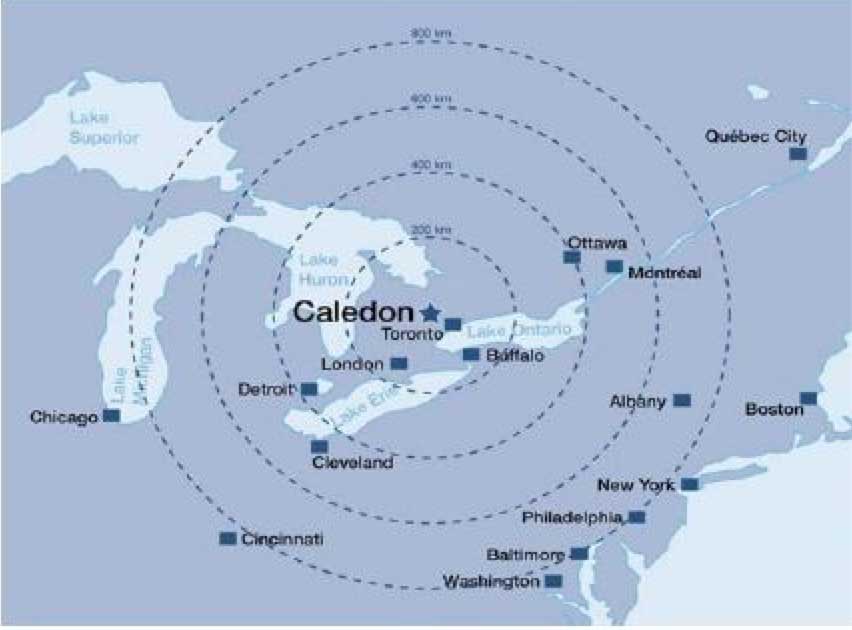 [Update in February 2014. I just came upon several new images illustrating the Toronto region in the economic world. Caledon is a mostly rural municipality that has adopted the centre of the circle marketing strategy. But its almost-neighbour Milton has leapt to the global scale, as has the Greater Toronto Marketing Alliance (which shows the Greater Toronto Area straddling Europe and Asia).


Apparently the scale of thinking of economic development departments in the region is beginning to move to the grander scale appropriate for FedEx and Google and other global organizations that I discuss in the next paragraph]

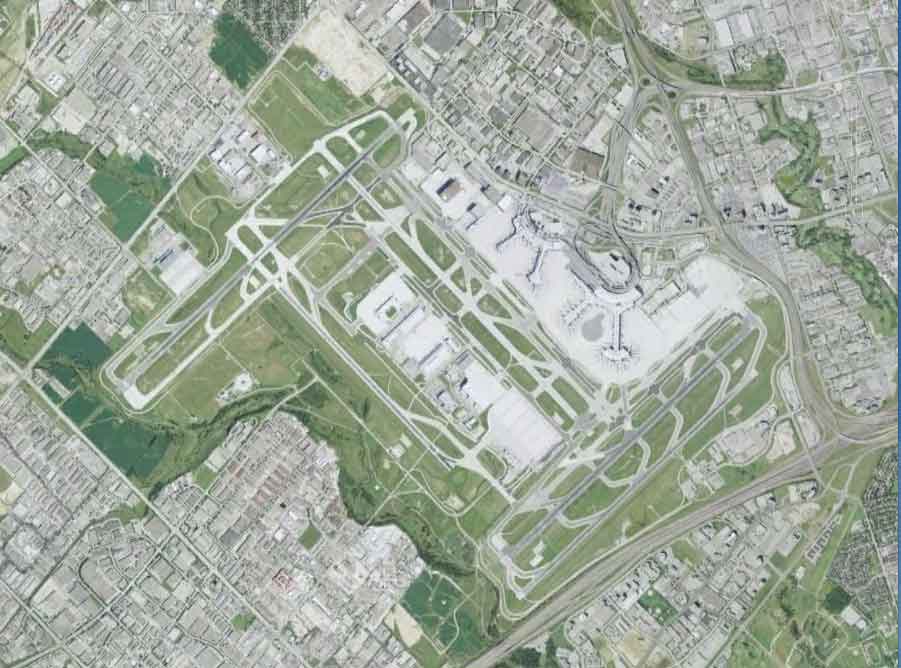
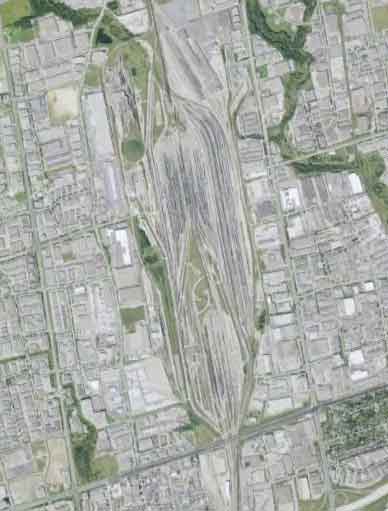
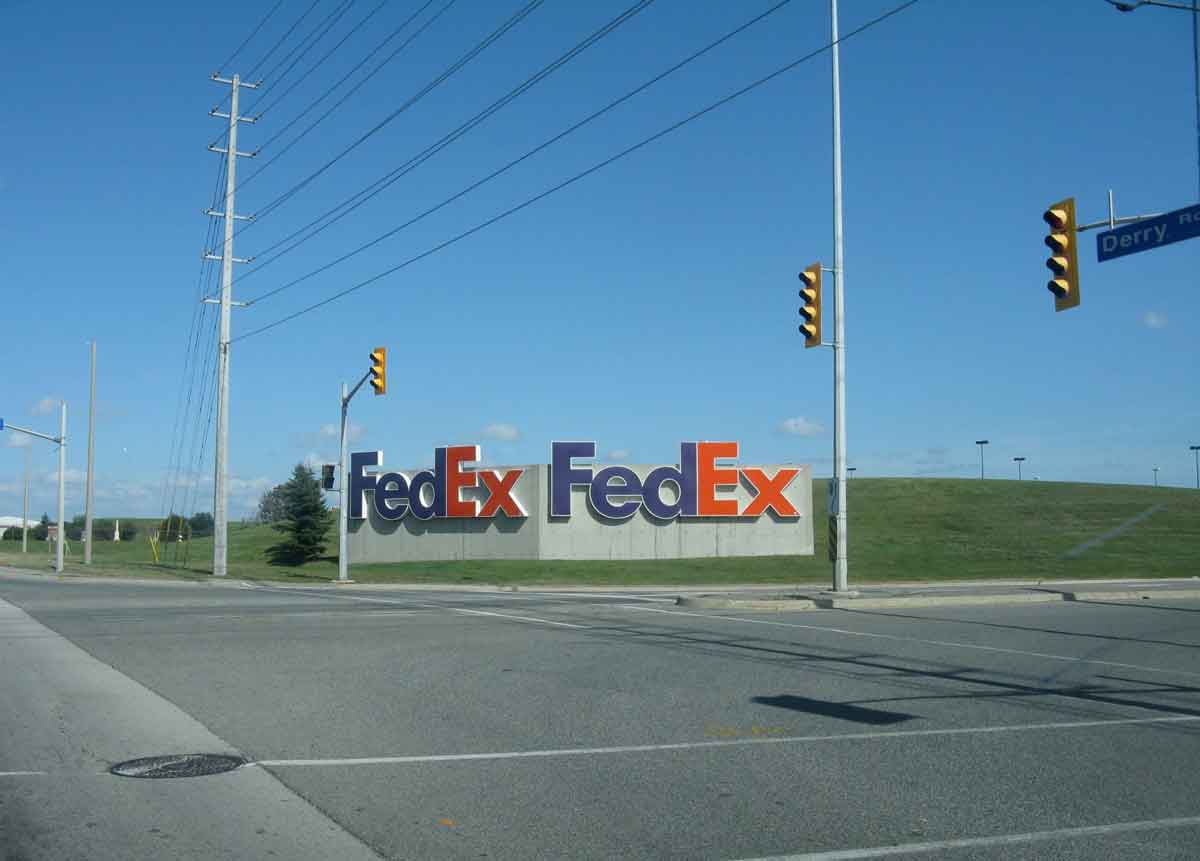 The old sort of central place geographical thinking and representation is not very important for the hi-tech activities that now play an increasing role in the regional economy. They move information electronically or goods by air or rail, and can fit into the geography of the region almost anywhere that meets their particular needs, for instance for young and creative employees, or for particular communications technologies. Here is the entrance to the new Google Canadian headquarters on Richmond Street in downtown Toronto (a location that takes advantage of the attractiveness of the downtown core for its employees, many of whom no doubt live in condominiums nearby). And the entrance from Derry Road to the FedEx cargo terminal at Pearson International Airport. The airport is a key facility for 21st century economic activities, both for moving people and goods between global cities. The area around it is the second largest centre of employment in the region after Toronto’s downtown core. Mississauga claims to have the Canadian headquarters of 50 companies, many of them, such as General Electric and Amazon’s regional fulfilment centre, close to the airport and Highway 401. Other key elements of the modern regional economy are the intermodal and rail yards where goods arrive from the west coast are shipped out to distribution centres.
Elsewhere on this website, I have used the following Google Earth images showing downtown Toronto, the airport and the Concord rail yard at the same scale, but I think it is helpful to include them again here to reinforce the point that while downtown gets most of the attention, they each occupy about the same area, and are all critical for the economic well-being of the metropolitan region in North America and globally.

Fragmented Regional Perspectives
In Chapter 8 I note that from the perspective of potential foreign investment, whether North American, European or Asian, the Toronto region is presumably seen as an undifferentiated entity. The regional reality, looking from the inside outwards, is somewhat different because each municipality has its own economic development department anxiously promoting its supposedly distinctive merits as a location for business, and competing with all the other municipalities in the region to attract foreign investment. The OECD has pointed out that this sort of thing is symptomatic of a lack of coordination and government direction. And indeed, though there are provincially mandated regional plans to direct urban development (which I describe in Chapter 9 of my book), there are no equivalent plans for economic development.

There are, however, some organizations that attempt to correct this, including the Greater Toronto Marketing Alliance and the Toronto Region Board of Trade (see especially the latter’s Scorecard on Prosperity, with its emphasis on rankings and also its winter 2013 On Board magazine that strongly advocates a regional perspective and explores the future evolution of the Toronto Region), but I claim in my book that the most notable is Civic Action, a non-governmental, multi-facetted agency that is beginning to serve almost as an alternative form of government, filling in the gaps left by the provincial and municipal governments. This screen capture from Civic Action’s website gives a sense the variety of economic, social and cultural issues that now fall within its purview.
Social Globalization and Immigration
Economic globalization goes hand in hand with the social globalization associated with mass migrations that have occurred in the last 40 years. Here are some updates to population data, based on the table for Immigration and Ethnocultural Diversity in the National Household Survey by Statistics Canada for 2011 and on the Statistics Canada analysis of those data, neither of which were available when I wrote Chapter 8 of my book. One thing they show clearly is the massive scale of the Greater Toronto and Hamilton urban region in relation to the rest of Canada – it has a fifth of the population, and over two fifths of the immigrants and visible minorities.
- Toronto CMA 2011 Population 5,521,000 (16.8% of the population of Canada)
- Hamilton CMA 2011 Population 708,000
- Oshawa CMA 2011 Population 352,000
- [GTHA 2011 by CMAs Total Population 6,581,000] (20% of the population of Canada)An alternative way of counting 2011 population is by municipalities:
- Toronto 2,725,000; Durham 631,000; York 1,072,000; Peel 1,350,000; Halton 520,000; Hamilton 540,000. This gives a population for the GTHA of 6,838,000. The 2011 population of the Greater Golden Horseshoe is 9,026,000.
In the GTHA:
– 2,760,000 are immigrants, which is 42% of the GTHA population. Immigrants comprise 46% of the population of the Toronto CMA.
– 0f the 2,760,000 immigrants, 443,000 arrived prior to 1971, 348,000 between 1971-80, 425,000 between 1981-90, 710,000 between 1991-2000, 832,000 between 2001-11. In other words, 13% of the population of the GTHA consists of immigrants who have arrived in the last decade,
– about 40% of all immigrants in Canada live in the GTHA
– 2,740,000 are visible minorities, 41.5% of the GTHA population (for the Toronto CMA the proportion is 47%, in the City of Toronto 49%, Mississauga 54%, Brampton 66%, Markham 72%).
– The major visible minorities in the GTHA are South Asian (864,000), Chinese (548,000), Black (430,000), Filipino (243,000), Latin American (128,000), Arab (85,000), SE Asian (99,000), West Asian (103,000) and Korean (65,000).
– about 43% of all visible minorities in Canada live in the GTHA
Here are two maps from Statistics Canada for 2006 Census data that give a sense of the distribution of recent immigrants and visible minority populations in the region – both are concentrated in a band that consists of a part of the inner suburbs and the part of the outer suburbs adjacent to the City of Toronto (note that the scales and colour gradations on these two maps are not wholly consistent with each other). The lowest proportions are in the outer outer suburbs, and in the central and south-western parts of the City of Toronto.
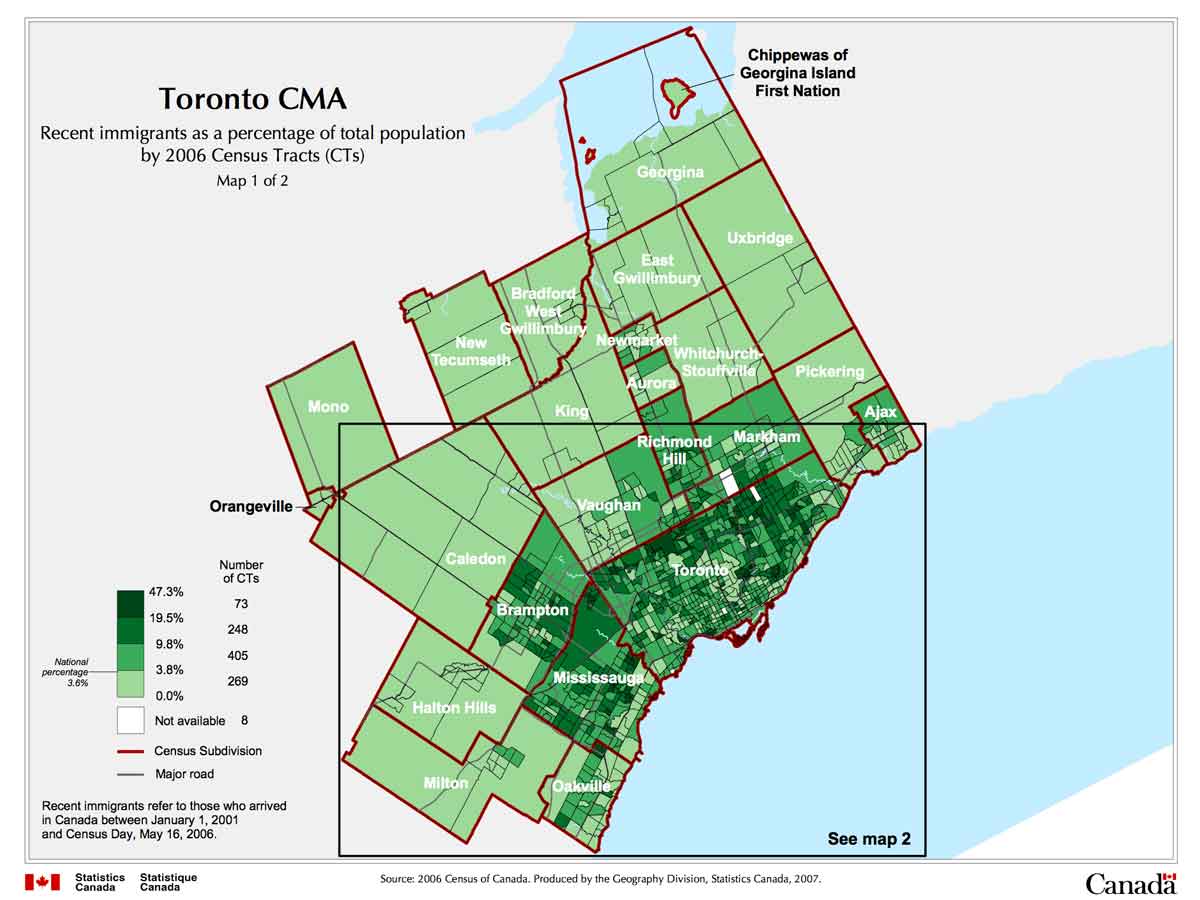
Distribution of recent immigrants (arrived 2001-2006) as a percentage of the total population in the Toronto CMA, from Statistics Canada
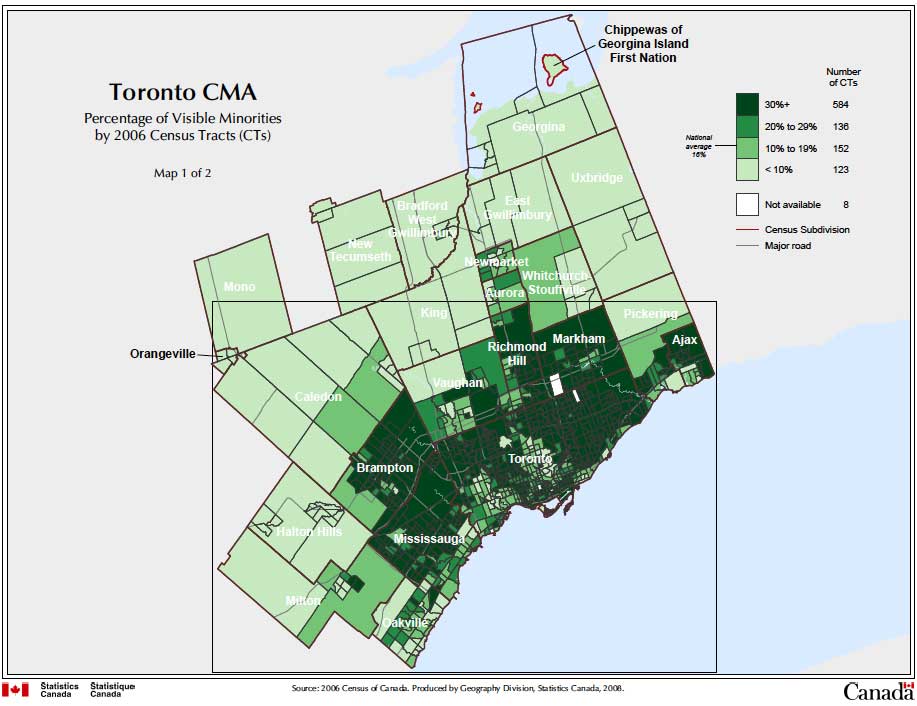
Distribution of Visible Minorities in the Toronto CMA 2006, from Statistics Canada
There is substantial landscape evidence of the scale of recent immigration, including storefront Newcomer Services, signs promoting international phone cards in shop windows, and employment services. The top two photos are from Scarborough; Skills for Change is in Brampton.


Diversity and Multiculturalism
it is hardly surprising that with almost half the population foreign born and about the same visible minorities that the urban landscape is filled with signs of ethnic diversity. Here are some examples, several of which – most obviously the abacus training centre which is in Market Village (adjacent to Pacific Mall in Markham) – are clear manifestations of social globalization.
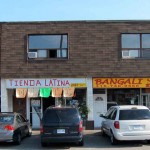
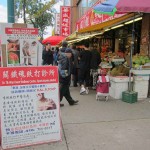

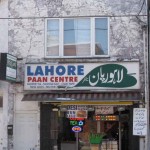


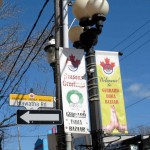
Although there are parts of the metropolitan area where particular ethnic groups are concentrated – South Asians in Brampton, Chinese in Markham for example – there is also considerable evidence of a multicultural blending of different cultures and their assimilation to older Canadian traditions. Here are some examples,
-

- Mural in Weston in Etobicoke, 2011
-

- Church in North York, 2013
-
- Signs in the South Asian commercial area at Gerrard and Coxwell about 2006
-

- Indian and Pakistani Pizza and Halal Beef Burgers, Iranian and Afghani DVDs, and a billboard for Quebec City’s 400th anniversary celebrations, in Scarborough
-

- A poster for the TTC about 2006
-

- Hoarding around a building site near St James Town, 2002
Indications of Inequality
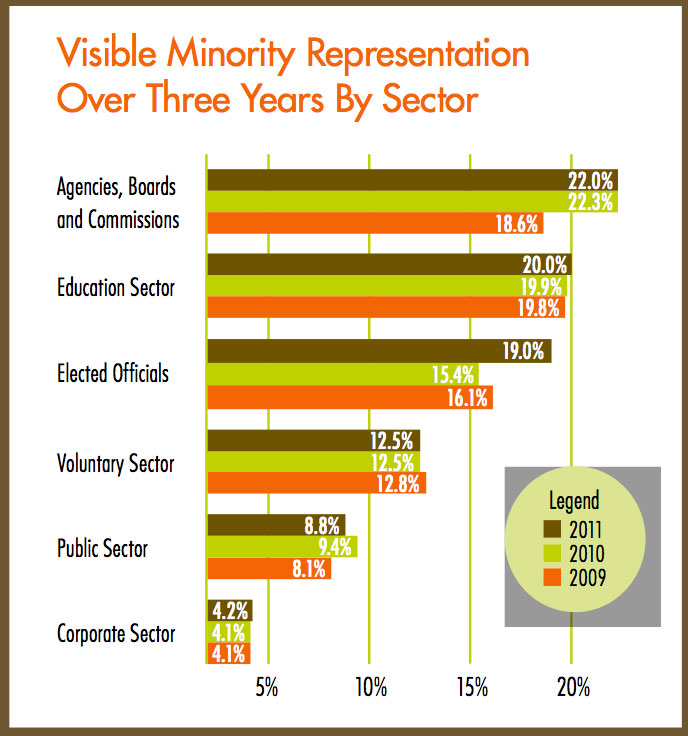
The visible evidence of multiculturalism in the region obscures the fact that there are serious concerns about cultural diversity and its relation to economic inequalities and to political hierarchies of power. The diagram below is from the 2012 survey by DiverseCity, an agency of Civic Action that monitors representation of visible minorities in positions of authority. These percentages have to be assessed against the 43% of the population of the GTHA who are visible minorities. I suppose an argument can be made that many immigrants are relatively recent arrivals in the region, and it may take a generation or more for individuals to work their way into positions of authority, but the fact is that no sector does well, and representation in the public and corporate sectors can only be described as dismal.
 This inequity of representation is reinforced by social and economic disadvantages. This is implied in the following map from Three Cities in Toronto, a study originally made in 2007 and updated to 2010 by David Hulchanski and his colleagues at the Cities Centre of the University of Toronto. This map and others in the report give strong evidence of increasing income polarization. Additional research shows similar processes at work throughout the Toronto region, though they are less pronounced in the outer suburbs than in the City.
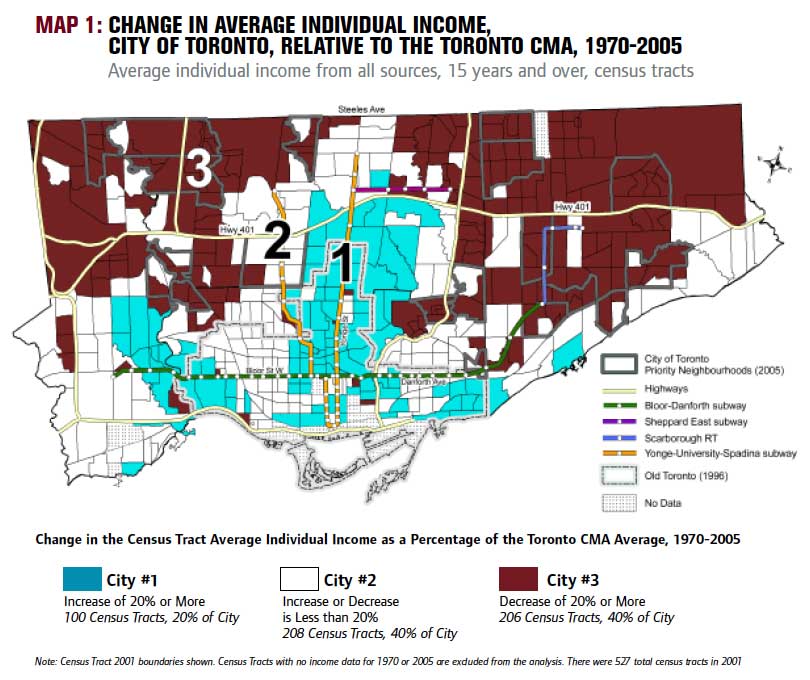
Briefly, what this map shows is that in City 1 the rich are getting richer, and in City 3 the relatively poor are getting poorer. The Three Cities study argues that City 2, effectively the middle income group, has been shrinking. Maps in Chapter 8 of my book relate this to visible minorities – City 1 is mostly white, City 3 is mostly visible minorities (compare this map to the maps of visible minorities above), but I also argue there that the evidence about the implications of this is not entirely clear and has to be assessed circumspectly.
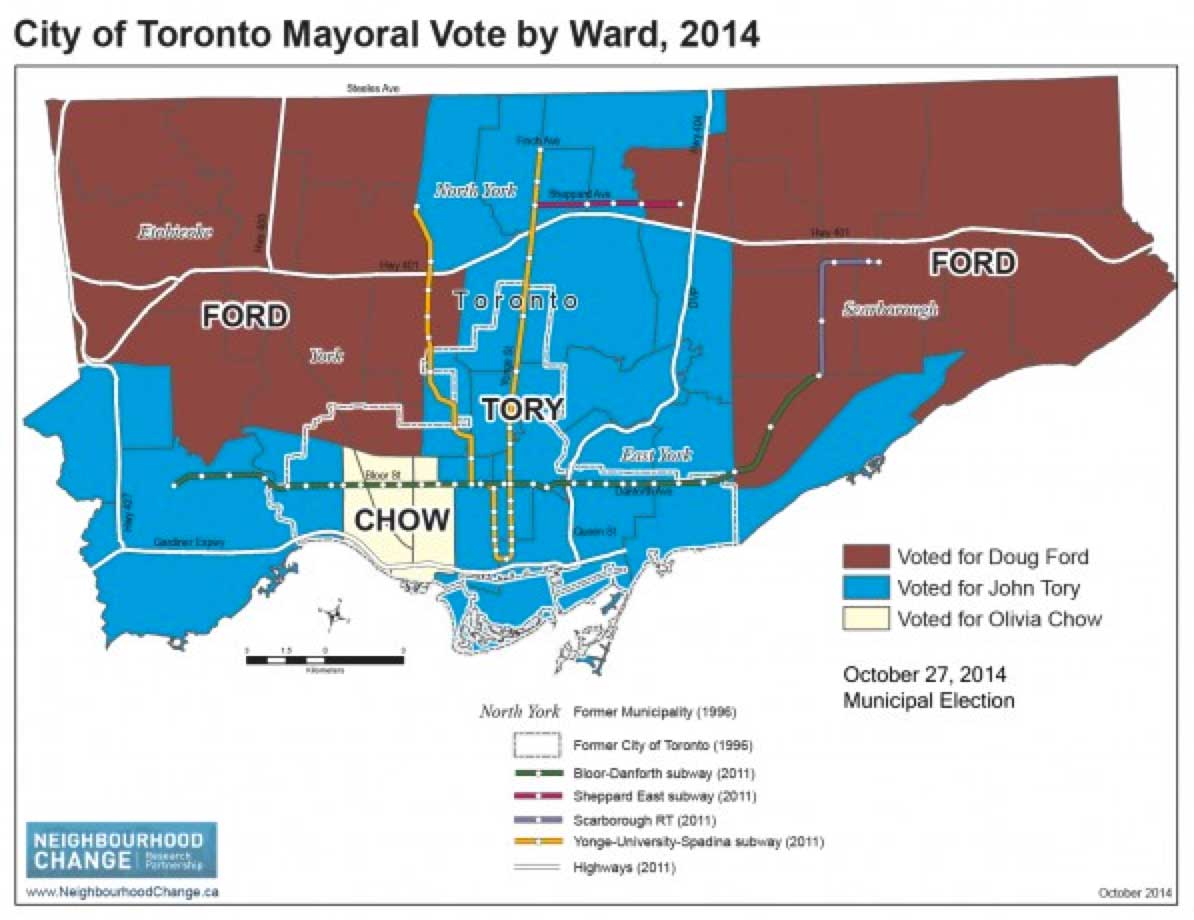
[NOTE: January 2015. One of the lead authors of the Three Cities study has mapped the voting patterns for the new mayor (John Tory won against Doug Ford, brother of the notorious,much criticized, erratic but populist previous mayor Rob Ford, with Olivia Chow coming a distant third) in the Fall 2014 election. Essentially, wealthy and mostly white City 1 voted for Tory, and relatively poor City 3 voted for Doug Ford, reinforcing the sense that the division between the Old City of Toronto and the inner suburbs persists. Here is his map of voting patterns:
 ]
]
Nevertheless there are clear indications of the polarization of income.
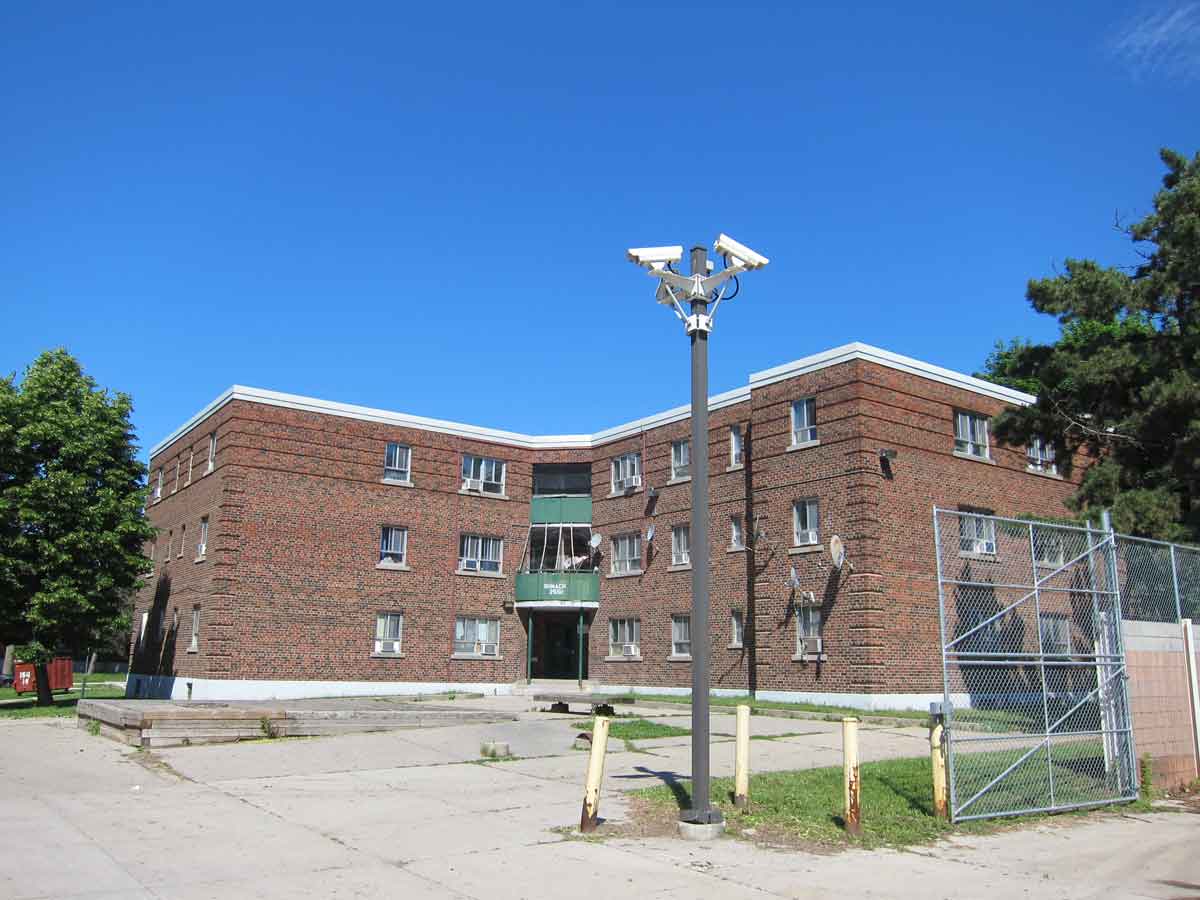
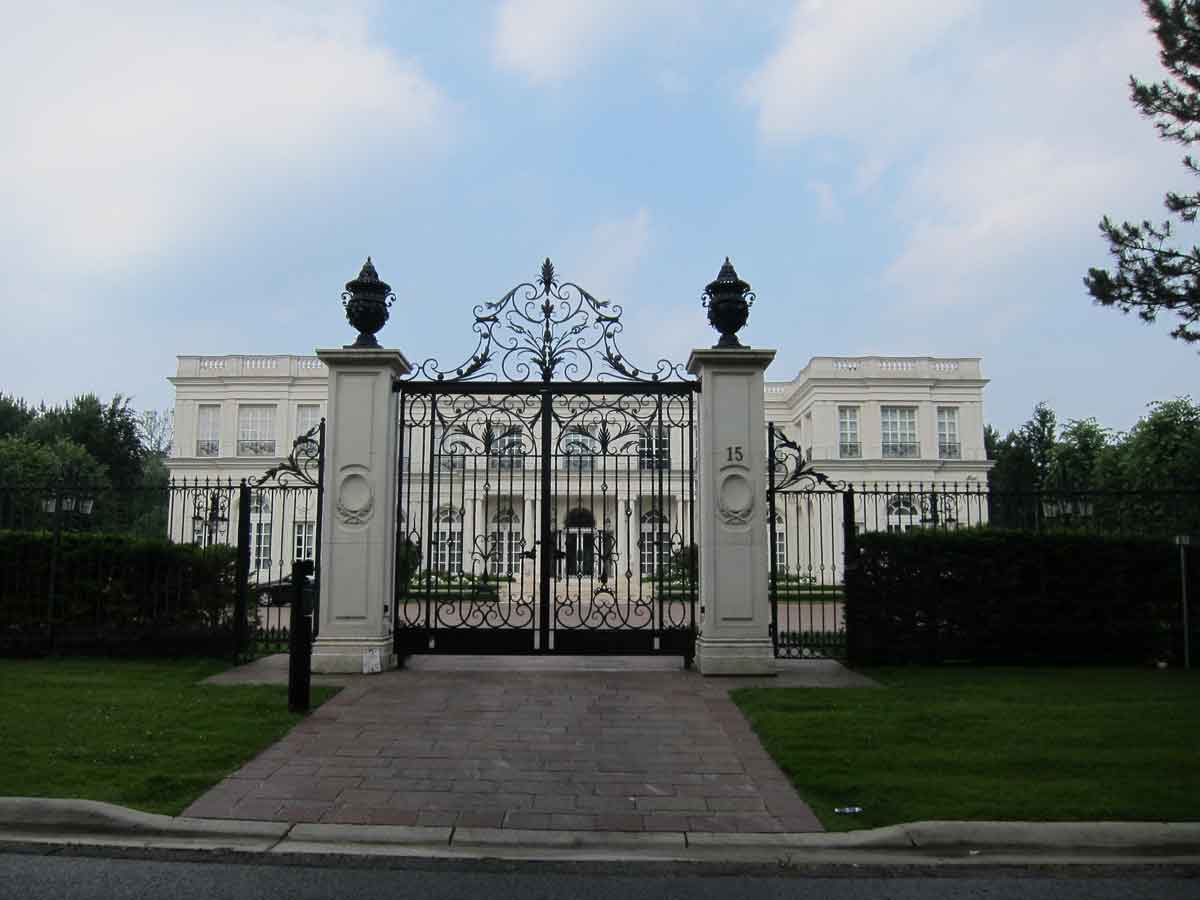
On the left above is one of the cheap, red brick blocks in the 1950s social housing project of Regent Park, the census tract with the lowest income in the City of Toronto; on the right is a gateway and house in the Bridal Path, the highest income area of the City.
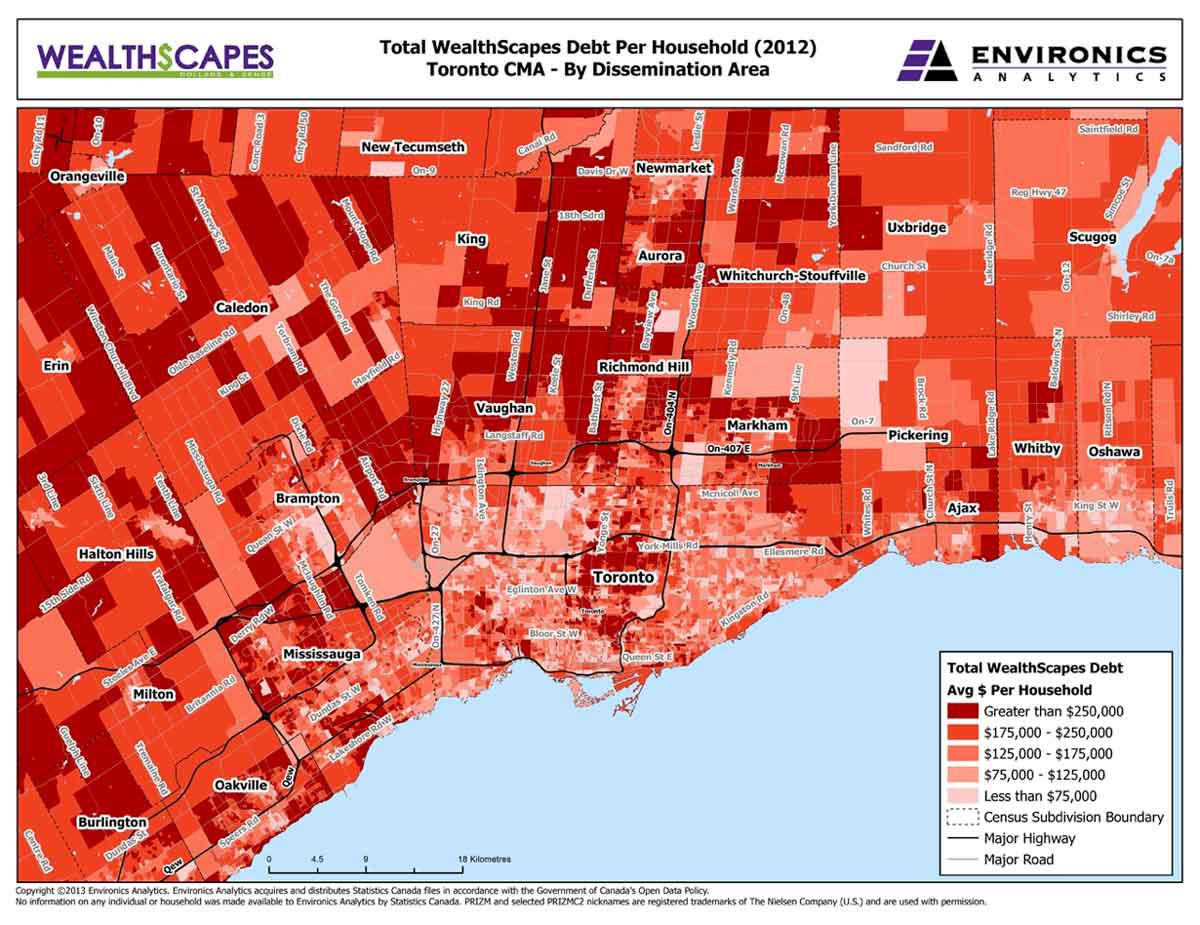
[NOTE: I have just (February 2104) come upon the map below from Environics showing debt levels in the Toronto region. This is interesting because it shows the highest levels of household debt generally in the outer suburbs and in City #1 in the City of Toronto. City #2 and City #3 are the palest areas on the map, with the lowest levels of debt. At the very least, this suggests that the households there generally have a level of indebtedness proportional to their incomes, and reinforces the need to avoid making hasty interpretations about the material in the Three Cities report.]
More on Inequality

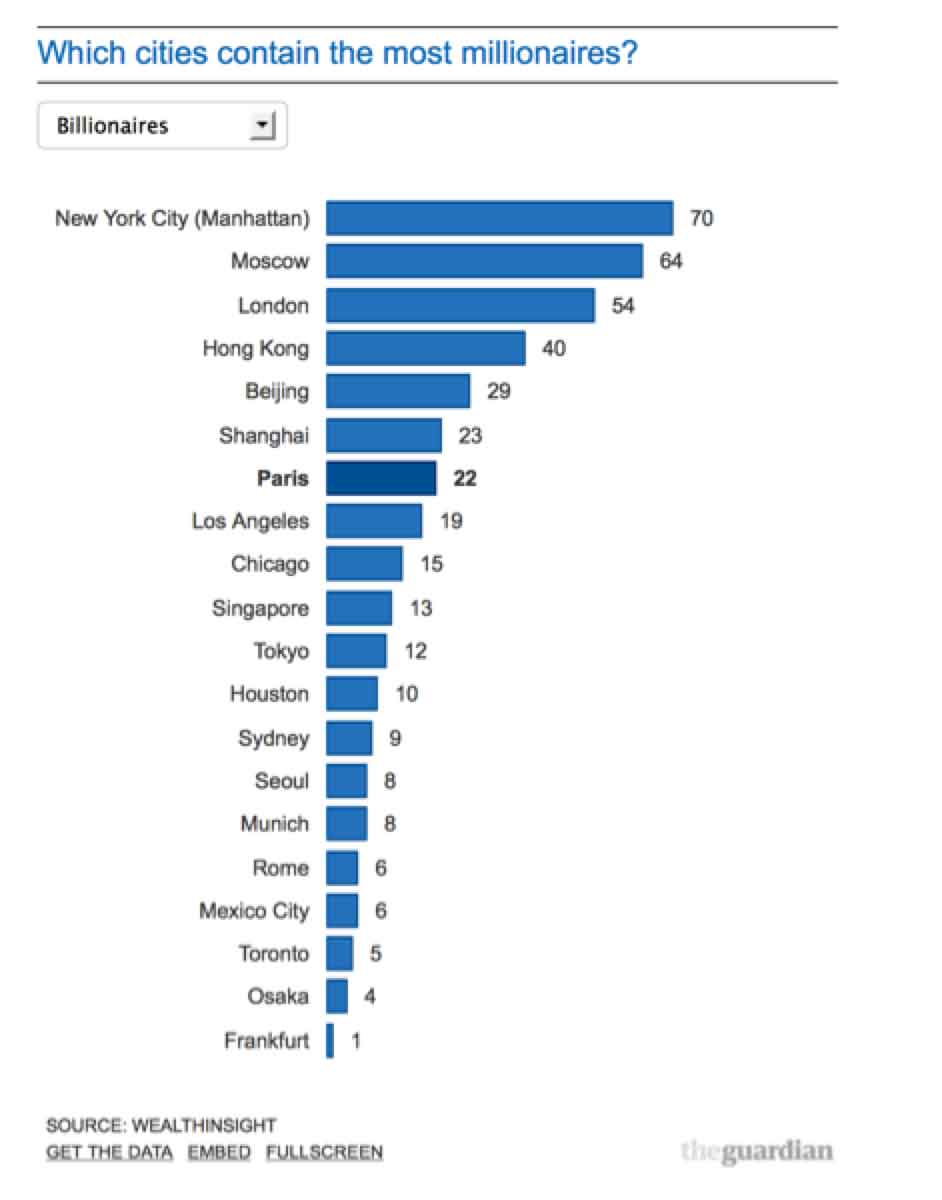
On the left above is a self explanatory sign on one the City’s trash cans, on the right a graph from The Guardian which shows that Toronto just makes it into the top twenty cities in the world for the number of billionaires.
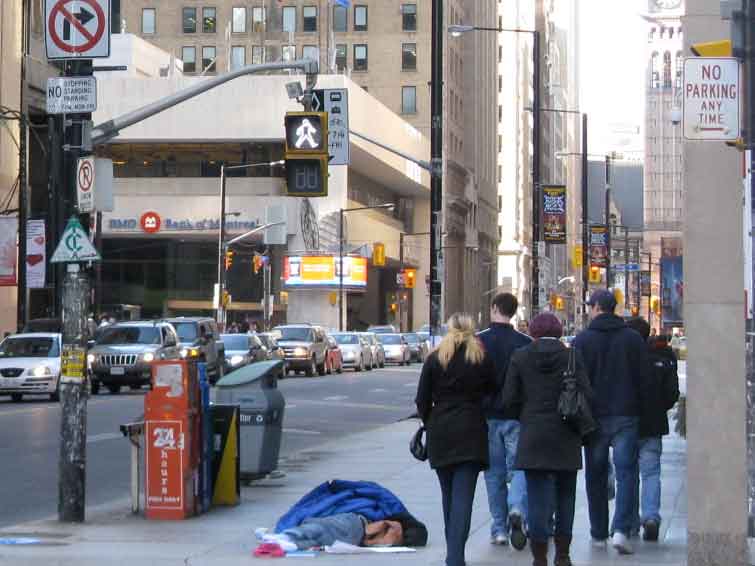
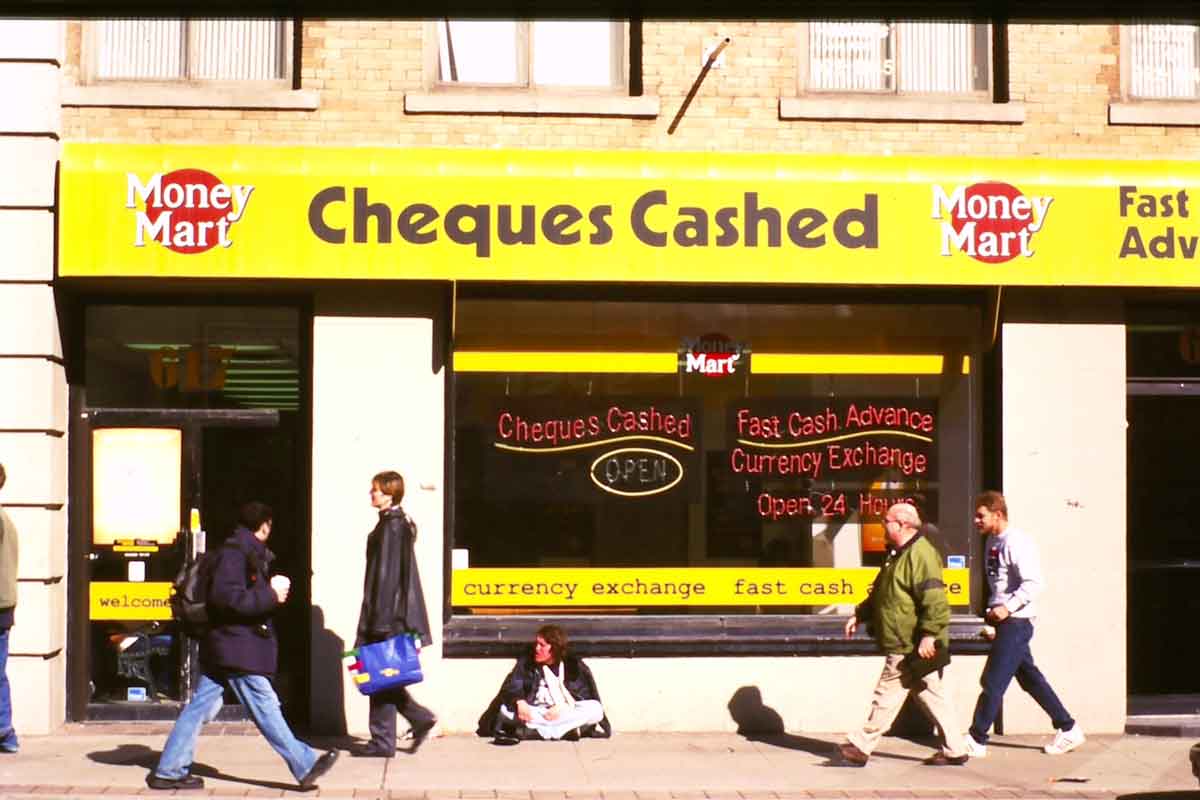
On the left, a homeless man sleeping on the sidewalk in the financial district (where heating vents provide a small measure of comfort); on the right, a cheque cashing store – one of the indications of low income neighbourhood.
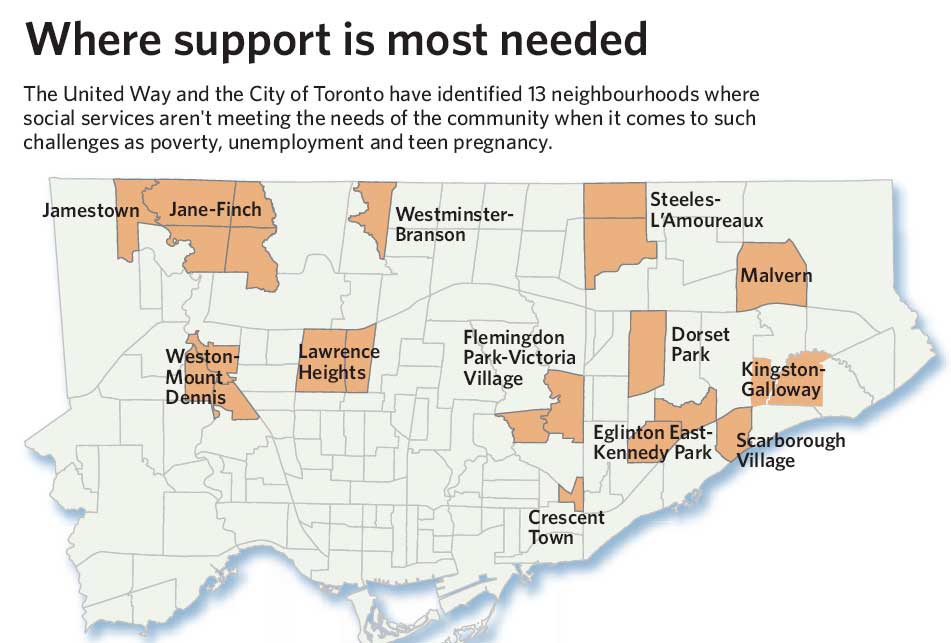
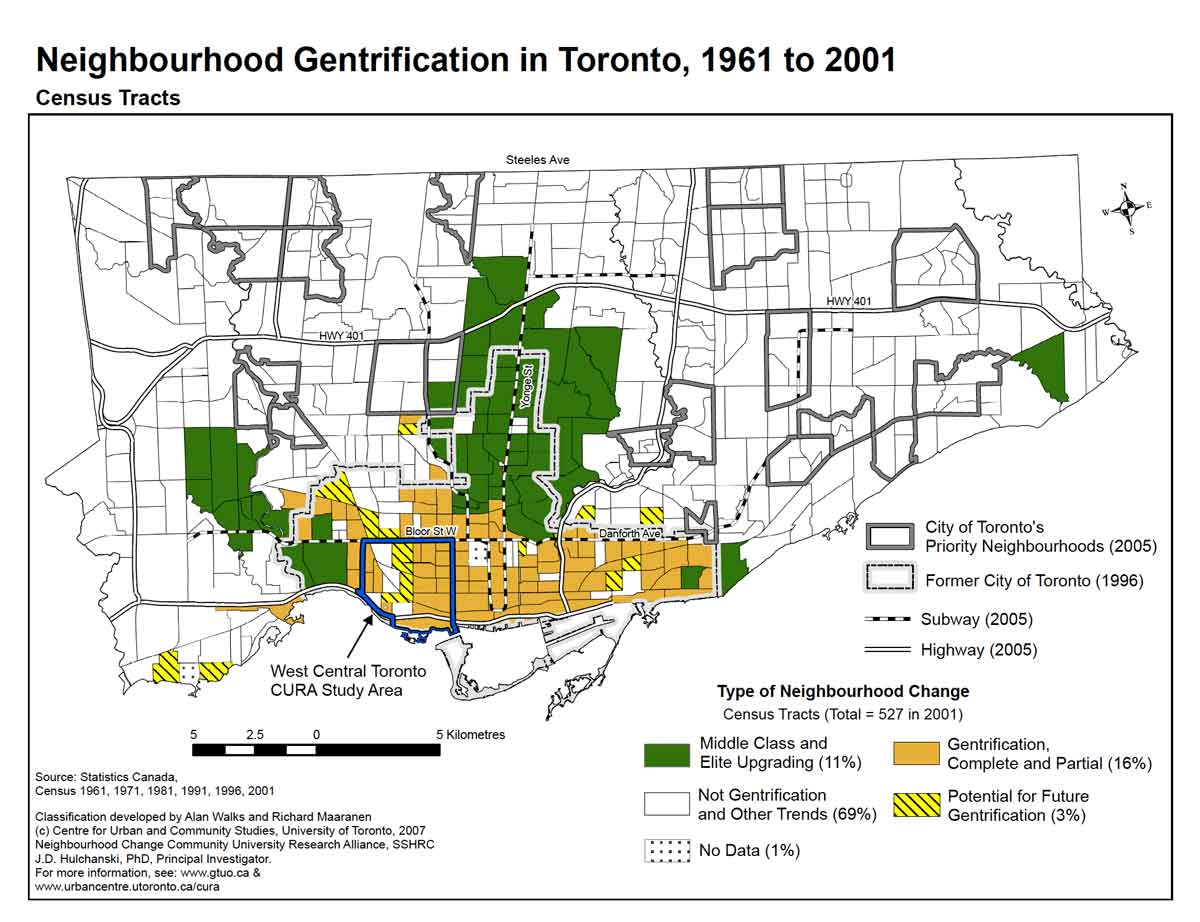
On the left above is a map of Priority Neighbourhoods in the City of Toronto. These were identified in a 2005 report titled Strong Neighbourhoods: A Call to Action, a joint effort between the City and United Way, and then established as a means to provide geographically focussed assistance for social and other services; they are are all in the inner suburbs. [In early 2014 these were relabelled Neighbourhood Improvement Areas, and a new set of designated areas will be identified later in the year. Check here for updates] On the right is a map of neighbourhood gentrification, effectively a map of the affluent areas of the City, from a 2007 study by Alan Walks and Richard Maaranen for the Cities Centre of the University of Toronto. Gentrification is entirely within the old streetcar city of Toronto. The map also shows middle class/upgrading districts (in green) concentrated along the Yonge Street corridor and the Kingsway in Etobicoke.
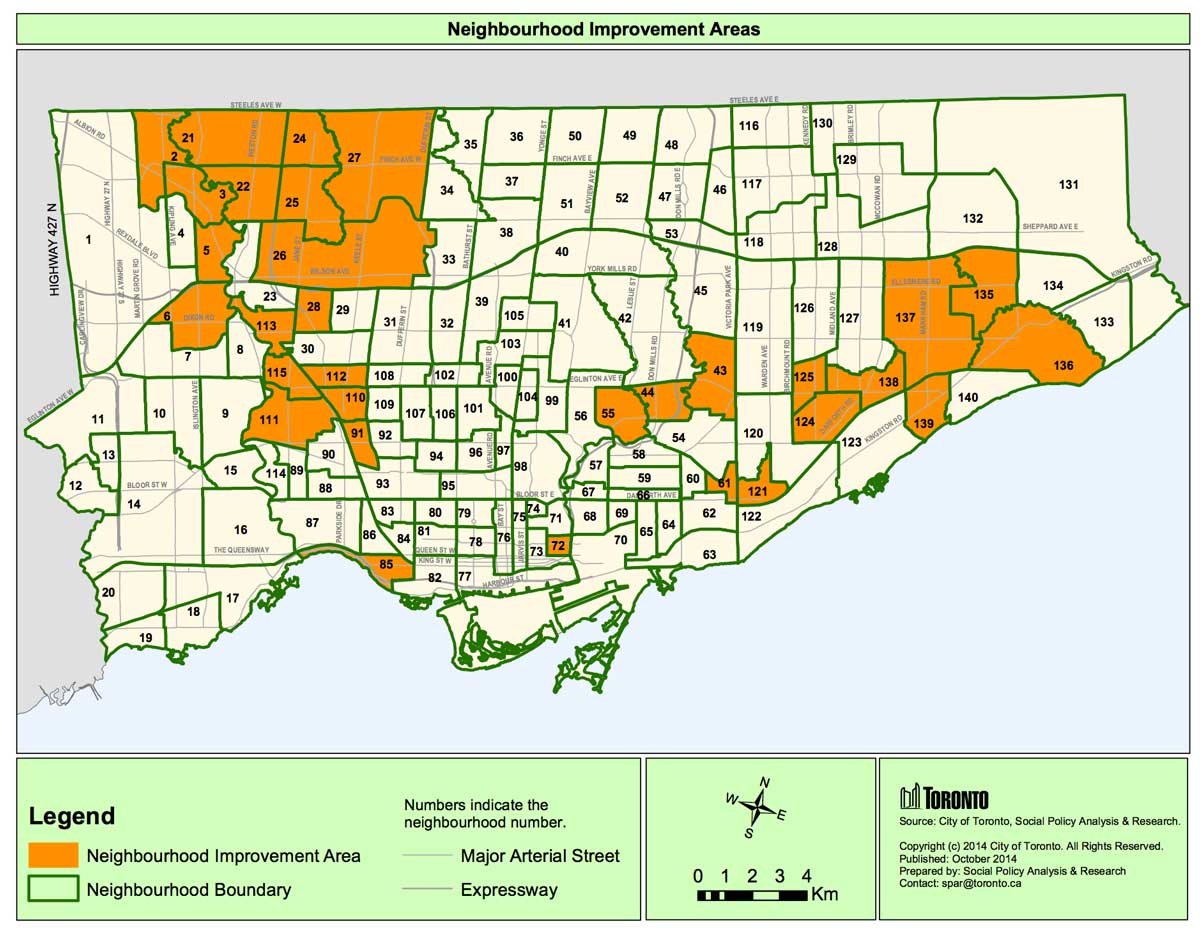
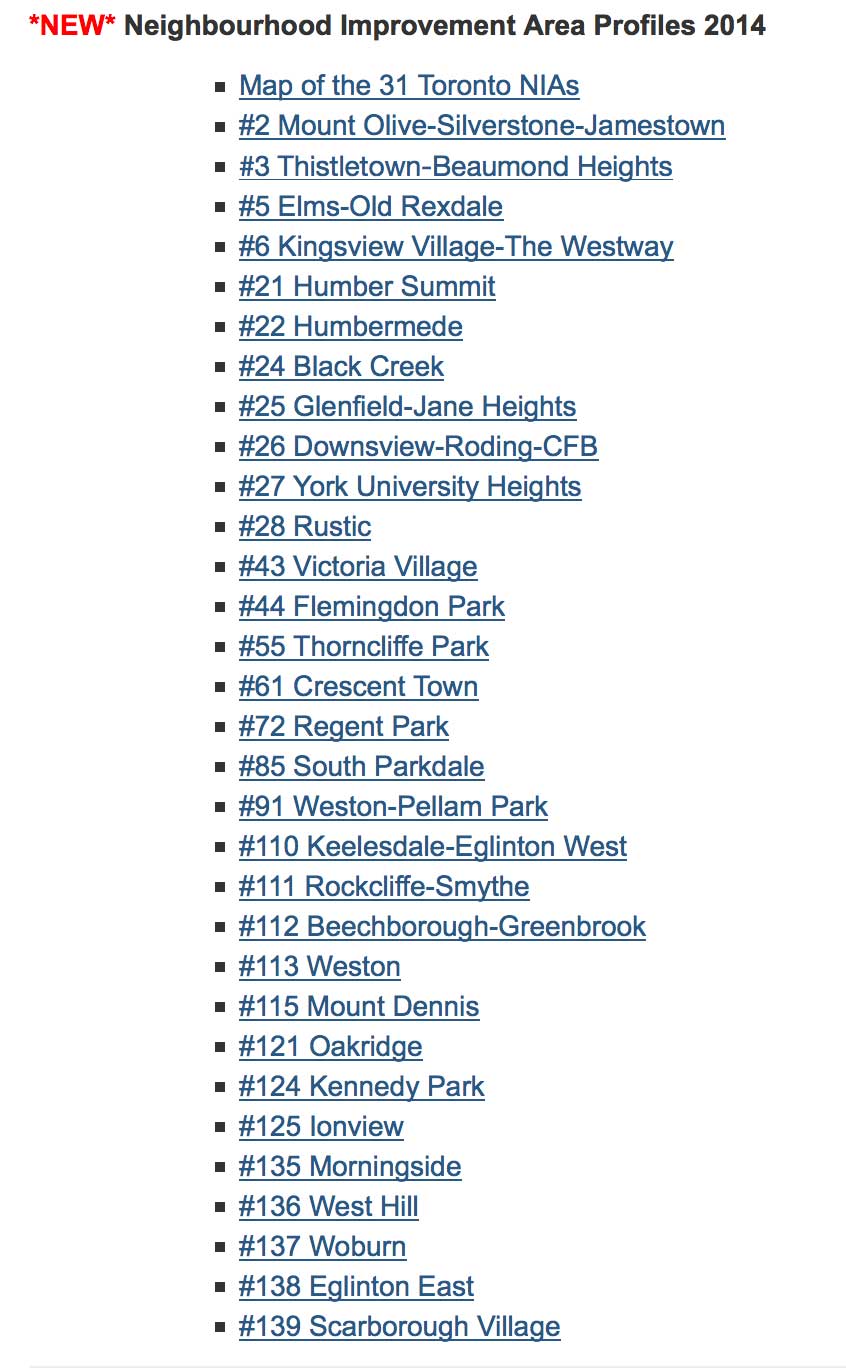
[NOTE added January 2015: In March 2014 Priority Neighbourhoods were reassessed and redefined as Neighbourhood Improvement Areas (NIAs). The two overlap in part, but there are 31 NIAs identified compared with the 13 Priority Neighbourhoods – though the increase is largely because a more fine grained approach has been adopted in the context of the Strong Neighbourhoods Strategy 2020. Profiles of the NIAs are available on the City of Toronto website here. This is the revised map and a list of the NIAs – both should enlarge when you click on them them.
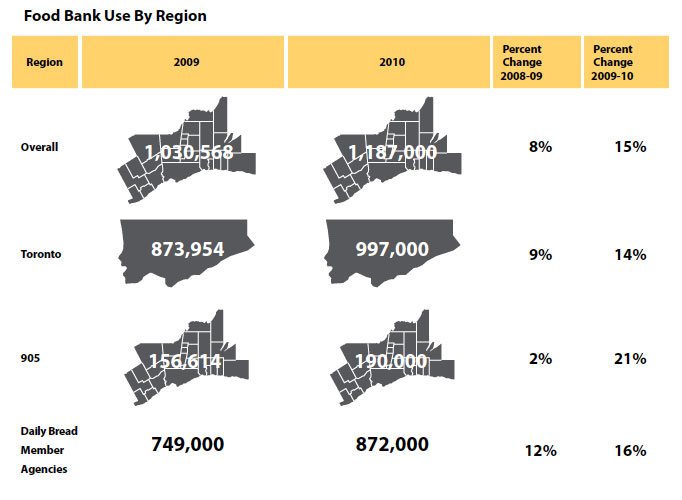
The issues of income polarization and growing social problems are certainly concentrated in the City of Toronto, but they are not confined to it. This diagram from a Daily Bread Food Bank study of Hunger in the GTA in 2011 shows that use of food banks in the outer suburbs (the 905), even though absolutely it is only about one fifth of that in the City, appears to be growing more rapidly.
Some of the other reports I used to inform my discussion of these issues are The Colour of Poverty, Greater Trouble in Greater Toronto by the Childrens’ Aid Society, and two reports by United Way – Poverty by Postal Code: The Geography of Neighbourhood Poverty 1981-2001, and Vertical Poverty: Poverty by Postal Code 2, 2011.
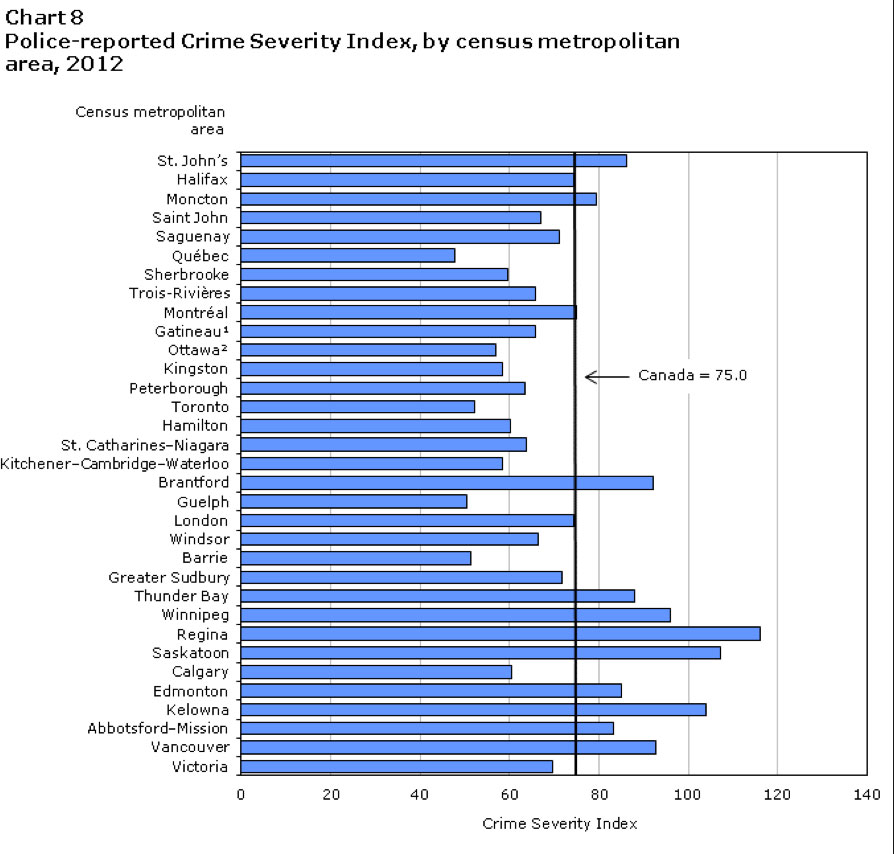
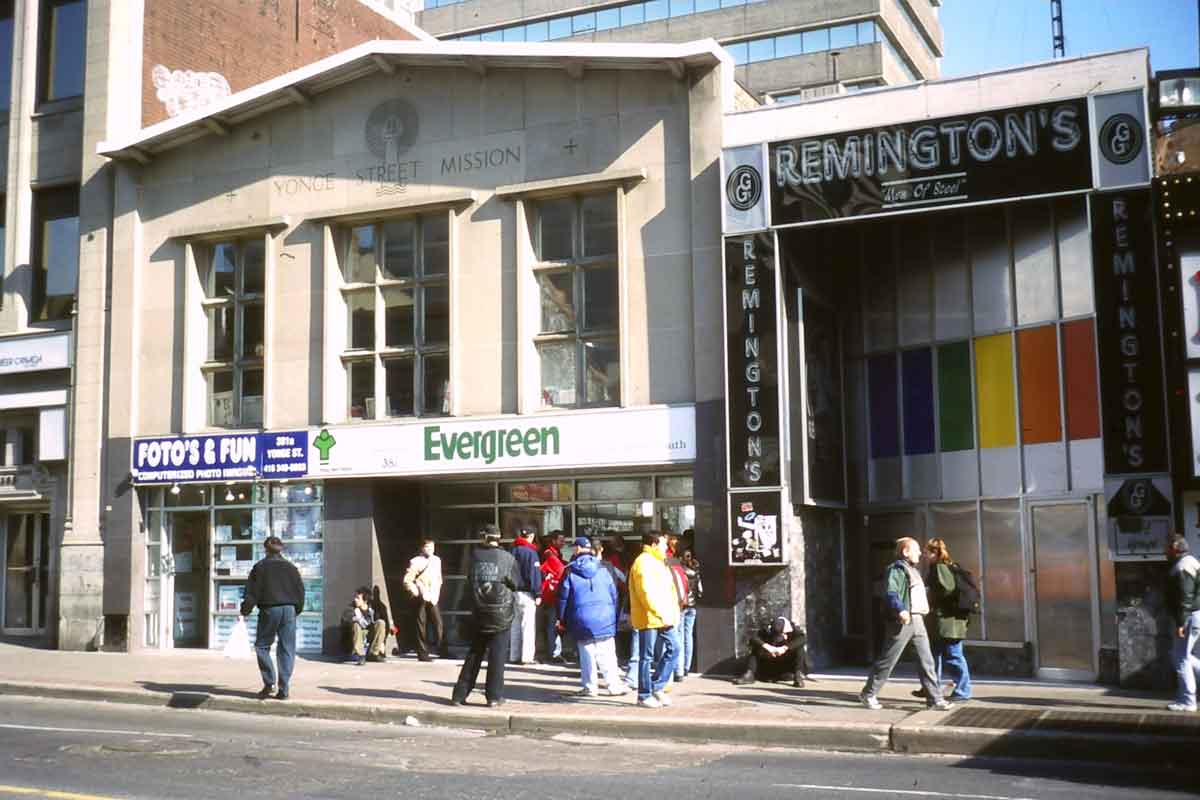 Finally, it is important to keep these indications of social disadvantage and economic hardship in perspective. Historically, the problems of the poor have long been part of the central City. The Yonge Street Mission (now Evergreen) shown on the right was founded in the 1890s, and is still in the same location, serving much the same purpose of helping those in serious need it always has. Geographically, it seems that increases in the income gap are a by-product of economic globalization, and while I am dismayed that the wealthiest societies in history have not been able to distribute wealth more equitably, the fact is that in comparison with some other global cities, such as London and Paris where there have been major and violent protests, Toronto’s problems seem to be modest. One indication of this which I mention in Chapter 8 may be the relatively low crime rates throughout the Toronto Region. The 2012 Crime Severity Index, which measures the number of crimes in relation to population in 239 police communities with populations over 10,000 in Canada, ranks the City of Toronto 124th for overall crimes and 35th for violent crimes, and all the other parts of the region ranked lower than this. This chart from a Statistics Canada report on Police Reported Crime Statistics in Canada for 2012 shows that Toronto ranks among the lowest of all census metropolitan areas in the country.
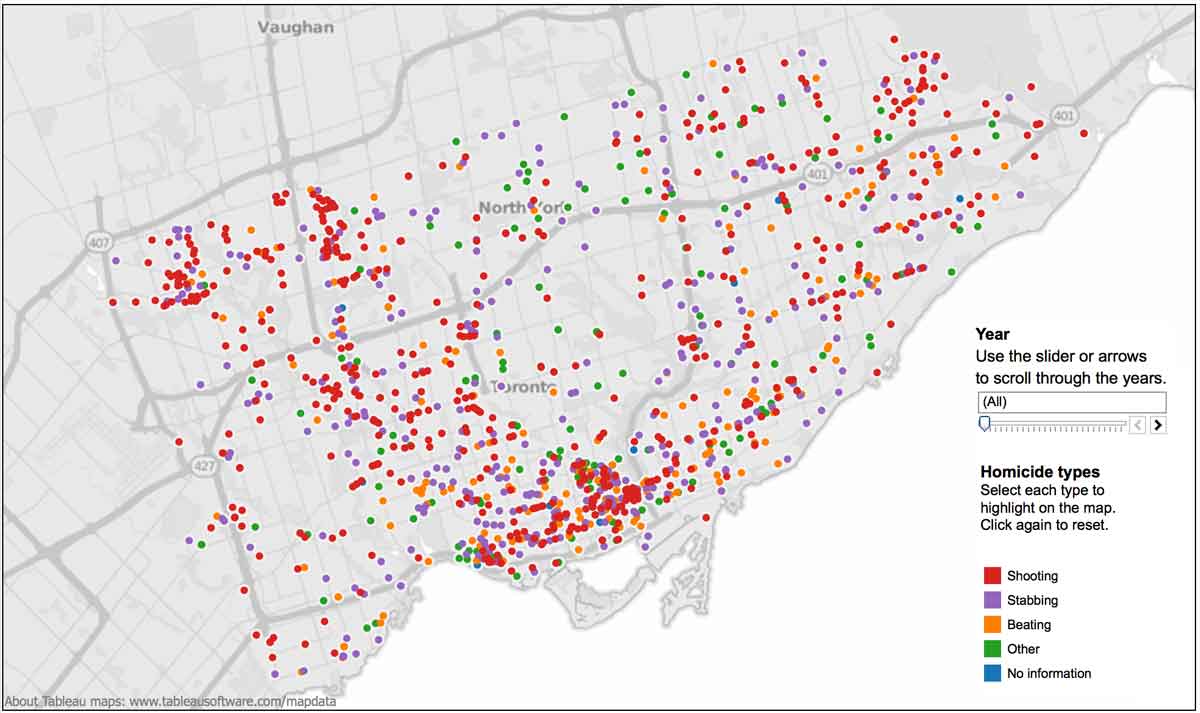
Nevertheless, Toronto is a large city, and has its share of violent crimes. This map below showing the location of homicides in Toronto from 1990 to 2013 is a screen capture from an interactive series of maps in the Toronto Star (so the slider and interactive features don’t work). While homicides have been distributed across the City, there are concentrations in the north-west and especially around downtown. The relatively wealthy Yonge Street corridor has had relatively few murders