Category Archives: Uncategorized

How many people are in vehicles on the move at any given time in Toronto? (April 2015)

[NOTE ABOUT A RECENT MINOR HACK: 

The apparent link to porn sites that appeared below the menus and led to a “404 Page not found” message should have been deleted thanks to a useful application called SiteLock that removed the malware.]

A few days ago I was driving in heavy traffic on Highway 401 near the airport when a factoid sprang to mind – At any given moment about 500,000 people in the world are in the air, flying somewhere.  The follow-up question came almost immediately.

At any given moment, how many people in Toronto are in vehicles, on their way to somewhere?

traffic2401

Highway 401 at Leslie

Clearly, given all the cars and trucks on the fourteen lanes of the 401, that number is considerable. Add in traffic on other expressways and the streets of the City and the inner and outer suburbs of the GTHA, plus passengers on buses and the subway, and it was not difficult to guess that it might well approach half a million.

So I went digging for information. While I don’t know of any count of vehicles in the region, the most recent StatsCan figures (for 2104) put the population of the GTHA at 7,204,000 (Toronto CMA 6,055,000, Oshawa CMA 384,000, and Hamilton CMA 765,000). There are about 2,000,000 households, and it doesn’t seem unreasonable to assume that on average each household has at least one vehicle.

traffic6GO

GO Trains at Union Station. I did not include GO in my estimate.

The Ontario Ministry of Transport has traffic volumes for Provincial highways, including expressways, up to 2010 for Annual Average Daily Traffic (AADT). The City of Toronto “Signalized Intersections Vehicle and Pedestrian Volume” has data for an 8 hour period (usually 7:30 am – 6:30 pm with breaks) for 296 intersections, plus TTC Ridership – All Day Weekday for Surface Routes, (buses and streetcars), and TTC Ridership Subway and LRT. Peel Region has data for 298 stations.  Durham Region has data up to 2012 for about 350 stations. York Region has a business like approach and charges an administrative fee for data on traffic flows, so I don’t have York’s counts!

These data have been collected in different ways at different times by different agencies, and of course a single vehicle can be counted several times as it moves through the city, but together they can give a broad approximation of how many people are usually in a vehicle on the move in the Toronto region. Incidentally, I have included neither GO transit nor regional transit systems in this rough estimate, which I think is, if anything, low.

My estimate is that at in any given 15 minute period during a business day about 350,000 people in the GTHA are on the move in cars or trucks. Another 40,000 are on the subway, buses or streetcars.  That’s a total of almost 400,000 people on wheels going somewhere any time during a weekday.

To put this in perspective, even though 400,000 is an enormous number, it is just under 6 per cent of the 7.2 million population of the GTHA, a substantial majority of whom are commuting to work or college or school every day, or going shopping or to visit friends.  It is nevertheless a salient reminder of the fact that cities are places in a sort of constant Brownian motion, albeit sometimes very slow motion, as much as they are places of streets and buildings and spaces.

traffic4veryslow

Here’s my rough and ready method of calculation

Pulses in Traffic Flows on Hwy 401 and Expressway Traffic (from Toronto:Transformations in  a City and Region)

Pulses in Traffic Flows on Hwy 401 and Expressway Traffic (from Toronto:Transformations in a City and Region)

I took the Average Annual Daily Traffic flows from the Provincial data for one point in the GTHA for each expressway, and divided them by 24, to get a vehicles per hour number.  Because traffic flows pulse over the course of 24 hours – high during the day and low at night this number is actually quite conservative. I did the same with data from the various Regions. For  the City of Toronto Signalized Intersections data I first divided by 8 to get an hourly count, but presumably a lot of vehicles will pass through several intersections within an hour and there is double and triple counting, so I divided again by 4 to get a 15 minute count.

Here are the Provincial AADT numbers:
QEW (section near the Gardiner) 179,000
401 (at Islington) 403,000
403 (Hurontario) 205,000
404 (Sheppard) 302,000
409 (near 401) 82,000
410 (near 401) 110,000
427 (Eglinton) 356,000
Hwy 5 27,000
Hwy 6 12,500
Hwy 7 26,500
Hwy 10 21,300
Hwy 11 40,600
DVP 180,000

That’s a total count of 1,945,000 vehicles per day, or 81,000 per hour, though as you can see from the graph of pulses, the number during the day is much more than that. I assumed most expressway trips take about an hour and did not divide further.

Buses at Square One Terminal, Mississauga City Centre. I did not include regional transit systems in my count.

Peel has 298 stations with a total 2014 traffic flow count of 2,919,000 vehicles or 121,625 per hour – these stations are close together so I divided by 4 to get a 15 minute count of 30, 406.
Durham has 360 stations, but the data is on a pdf and there is no quick way to total flows. Numbers at individual stations on some key busy roads (Bayly, Westney, Thickson, Brock, Simcoe, Taunton, Whites, Altona and Highway 2) totalled 270,000 – or 11,250 per hour.


Streetcar

Streetcars on Queen Street.

The City of Toronto 8 hour count at 295 signalized intersections totalled 5,510,296 vehicles (18,679 per intersection) – for a one hour total count of 688,000 vehicles. Because many of the intersections are close together individual vehicles will have been counted several times, so I divided this by 4 to get a 15 minute count, which is 172,000. The TTC numbers are for typical business day ridership (surface routes 1,666,000; subway 1,300,000 arriving platform usage; I took the totals and divided by 18 (assuming very low ridership for six hours at night), and then by 4 to get a 15 minute count.


A final, sobering, note. The City of Toronto Signalized Intersections survey also counted pedestrians. There were 572,841 pedestrian movements compared with 5,5510,000 vehicles – a ratio of vehicles to pedestrians of 10:1; only in the heart of downtown do pedestrians outnumber vehicles, and even there only at a few intersections.

The Greenbelt: Some Critical Observations for the 2015 Review (Jan 2015)

Two recent articles in the Globe and Mail offer contrary opinions about the Greenbelt, which is being reviewed in 2015 for possible expansion. Tom Curtis, a real estate policy professional, argues that it has led to increased house prices by restricting land supply, and contributed to the “Manhattanization” of Toronto’s downtown core, gentrification and overcrowded transit. Jennifer Keesmat, the chief planner of the City of Toronto, replied that house prices have risen in many Canadian cities, regardless of whether they have greenbelts, and that greenbelts make cities more livable, affordable and transit-friendly. Curtis suggests that greenbelts raise issues of social fairness by reducing housing affordability; Keesmat claims that they help to promote walkability, cyclability and transit use.

While I support anything that makes cities more walkable, in Toronto’s case I think there is little evidence to support the idea that it is specifically the Greenbelt that is encouraging this, or that it is somehow responsible for rising house prices.

The Greenbelt is one of three related provincial plans, which are discussed in the entry on this website for Chapter 9 – Containing Growth. The others are the Growth Plan, which aims to concentrate future growth in 25 urban centres, and the Big Move, which promotes transit to and between those centres through its agency Metrolinx. It is the Growth Plan and the Big Move that explicitly promote concentration, walkability and transit use. The Greenbelt is in the background, a sort of symbolic barrier to future expansion. There is ample space for urban expansion until at least 2030 at the denser levels required in the Growth Plan. Some time after that urban development will, in effect, bounce back off the Greenbelt or leap over it. In the City of Toronto, at least, the prices of detached houses have risen steeply is because of underlying economic reasons that have affected much of Canada, compounded by the fact over 90 per cent of all the dwellings built there in the last few years have been apartments or townhouses (see my Feb 2014 post about Condominiums on this website). There’s a growing shortage of single-family detached houses in the City of Toronto.

The Greenbelt Plan defines the Greenbelt “as where urbanization should not occur in order to provide permanent protection to the agricultural land uses and ecological features and functions.” It’s easy to imagine it as a pristine belt of countryside, something reinforced by maps that display wide bands of green, for instance between Newmarket and Richmond Hill. This is not the impression you get from driving this stretch of Yonge Street, which is almost continuously urbanized. Indeed, examine almost any part of the Greenbelt on Google Earth and you can see extensive areas of exurban housing, much of it on two and five acre lots mostly screened from people in passing cars by bands of trees. With towns, and exurban estates, gravel pits and quarries, golf courses and horse farms, the Greenbelt is as much an example of low density urbanization as of protected natural heritage and green spaces. This is not a criticism, but a recognition of how things are. Here are two examples, respectively from near the Forks of the Credit and Ballantrae.

Exurban estate near Forks of the Credit

c3.ballantraeexurbanweb

Finally, from the perspective of the Greenbelt Plan Toronto apparently does not exist because it does not mention Toronto, not even once. This is especially remarkable given that the Greenbelt Plan states bluntly that “settlement areas outside the Greenbelt are not permitted to expand into it”, which clearly implies that it is intended to restrict the outward expansion of the built up area of Toronto. It is apparently not Toronto’s Greenbelt but some sort of free-standing green entity in south-central Ontario. This is remarkably disingenuous, not least because maps in the Greenbelt Plan show Toronto as a grey blob pushing up against the green of the Greenbelt. The visual message is clear.

5GreenbeltPlan-web copy

I do think the Greenbelt Plan is important. It provides a strong and necessary measure of protection for the Oak Ridges Moraine and Niagara Escarpment, both of which are environmentally sensitive. But it is weakened by it failure to attend to what are obvious realities in and around the Greenbelt. Any worthwhile review has to acknowledge that the Greenbelt is part of a comprehensive regional planning process, that it protects extensive areas of previously developed low density, automobile dependent exurban housing, and that it surrounds and will limit the outward expansion of the urban area Toronto and Hamilton.

Transit in the Outer Suburbs of the GTHA (Dec 2014)

I haven’t paid much attention to this website as I should have for some time because I have had other commitments. But an article by Marcus Gee, “Suburbs are booming with transit” in the Globe and Mail, Nov 28, 2014, has prompted me to reflect on what is happening with transit in GTHA municipalities other than the City of Toronto. His article described some of the new buses, corridors and stations in Markham and Brampton and particularly the recently opened first section of the Transitway in Mississauga. This bus only lane along Highway 403 for MiWay (Mississauga Transit) and GO buses should be faster than car travel, and when the complete Transitway is complete it will reduce travel time to Pearson from downtown Mississauga from 50 minutes to 20 minutes. It is only one of a number of major investments to improve public transit facilities in the outer suburbs.

I have observed bus terminals, rapidways, emergent mobility hubs and so on for several years, but to put those into a broader context here I have turned to comparative data about the role of transit in the outer suburbs that are available in the National Household Survey 2011 data on commuting (Focus of Geography Series, Census subdivisions with more than 5000 population, Labour Tab, Mode of Transportation). These show numbers of people driving, taking transit, walking and cycling to work by individual municipalities. Then I consulted Walkscore.com for its assessment of walkability.

[The day after posting this I read the comments by David Hulchanski, Robert Murdie, Alan Walks and Larry Bourne at http://neighbourhoodchange.ca/2014/11/07/nhs/ about the worthlessness of NHS data because the global non-response rate is greater than 25% nationally and much higher than that is some neighbourhoods. I was aware of the Harper Governments meddling with the census, but this was the first time I have used NHS material and until now was not aware of the depths of its weakness. I have gone back to 2006 census data to check how they compare, and incorporated 2006 data into calculations of transit use]


YRTBayviewMajorMack

York Region bus stop at Bayview and Major Mackenzie

 Some Background ( Note: the following ridership numbers are from various sources and may not be consistent)

• There are regional transit systems in:

York Region Viva bus at Rapidway stop on Hwy 7, with densification in the background

York Region Viva bus at Rapidway stop on Hwy 7, with densification in the background

York Region, annual ridership 24 million, dedicated right of way (Rapidway) for express Viva buses partially completed along Hwy 7, links to York University, Finch Subway station, Fairview Subway station (and future Vaughan Station). Major mobility hub planned for area existing terminal at Yonge and Hwy 7 (Lansing/Richmond Hill). Densification along much of route, especially at Downtown Markham. Plans for corridors and hubs network.

Durham Region, annual ridership 11 million, plans for bus rapid transit. There is a major terminal at Pickering Mall, and links to GO train stations. An express route with traffic signal priority for ‘Pulse’ rapid transit buses runs along Hwy 2 from Oshawa to the University of Toronto Scarborough in mixed traffic, but it is intended to create an HOV lane in the near future.

• There are municipal transit systems in:

Brampton, annual ridership 12 million, Züm express buses currently operate in mixed traffic but with plans for dedicated lanes. They run to Mississauga City Centre and York University as well

MiWayMississauga (MiWay), annual ridership 35 million, dedicated right of way (Transitway) shared with GO, connects with Kipling Subway station. There are unfunded plans for an LRT running from Port Credit, through Mississauga City Centre to Brampton downtown.

Oakville, annual ridership 3 million.

Burlington, annual ridership 2 million.

Hamilton Street Railway, annual ridership 22 million. Inteconnects with GO at the Art Deco Hamilton GO station and at the new station at James Street being built for the PanAm games which will be the focus of a mobility hub. Has distant plans for an LRT linking downtown Hamilton to McMaster

GOtraincrossingRouge

GO train crossing the Rouge River. The ramp is part of the bridge for bikes and pedestrians.

The GO system of buses and railways, now under the aegis of Metrolinx, operates throughout the region. It has an annual ridership of about 75 million, expected to grow to 120 million by 2020. The commuter railway has the fifth highest ridership in North America after the three rail lines in New York City and Chicago, and 90% of its riders pass through Union Station. The trains carry about ¾ of all riders and buses carry ¼ (some on cross regional routes that by-pass the City of Toronto). The GO2020 Plan was developed in 2008 after the Big Move and incorporates many of its ideas and initiatives about hubs and corridors. The Green and White GO buses and trains are probably the strongest indicators of the range of the Toronto metro region.

• All transit initiatives in the GTHA are now governed by the Big Move plans of Metrolinx that concur with requirements for densification laid out in the Growth Plan for the Greater Golden Horseshoe.

• Total annual ridership of all these systems (including GO) is about 185 million compared with about 514 million on the TTC, though the population of the outer suburbs is greater than that of Toronto.

• The National Household Survey gives an average commuting time for the City of Toronto of 33.5 mins – that’s higher than Vaughan (30.5), Oshawa (30.6), Newmarket (30.9), Mississauga (30.9), Hamilton (26.7), and Burlington (27.8). Ajax (38.3) and Pickering (35.8) have the longest commute times in the region.

Comparative Data

Marcus Gee states that 84% of trips in Mississauga are by automobile. This does not quite correspond with the National Household Survey 2011 data on commuting which show 16% of commuting trips there are by transit, but an additional 3% are by walking and cycling. I think the combined percentages are more useful than the transit only one, so I show these in the table below. (In Victoria, for example, only 14% of commutes are by transit, but so many people walk or cycle to work that the combined value of all three is 47.5%).

 Walkscore.com has established the importance of walkability across North America, and its walkability scores are widely used by real estate agents. Walkscores are available for most of the GTHA municipalities, and I have also included these. The methodology can be questioned (in particular I am not sure of how they determine the areas they use) but it is consistent.  A score of 70 or more means a city is very walkable, 50 to 70 is somewhat walkable and some errands can be done on foot, less than 50 means most errands require a car. Note that Mississauga’s walkscore is the fourth highest in Canada for large municipalities (after Vancouver, Toronto and Montreal), and ranks 30th in North America.

Here are the values for the outer suburban municipalities in the GTHA – commute time, per cent trips by transit from the 2006 census and 2011 NHS, % trips combining transit, walking and biking from the 2006 Census and 21011 NHS, and walkscores from the 2014 Walkscore website. In mostly rural municipalities, such as Caledon, less than 10% of commutes are by transit/walking/cycling.

GTHAtransitrevised2web


In so far as the 2011 figures of dubious quality from the National Household Survey can be compared with the figures from the 2006 census, they mostly show small increases of about 2% in transit use and in transit/walking/biking to work. In other words growth in transit ridership/walking/cycling to work has slightly more than kept pace with population growth.

Comments

The outer suburbs with the most developed bus rapid transit systems attract about 1/3rd of the proportion of commuters as the TTC. In the GTHA only Toronto has a walkscore that rates it as very walkable, and eight of the outer suburbs are considered to be somewhat walkable. My guess is that Brampton, Markham and Vaughan will soon pass the 50 mark.

To put these numbers in perspective for all the major urban centres in Canada: Only Victoria (78), Vancouver (78), Toronto (71), Montreal (70) and Halifax (70) rate as very walkable. Burlington (54) ranks 11th in Canada. London (49), Kingston (49), Quebec City(49), Calgary (48), Peterborough(47) and Guelph (47) are about the same as most of the outer suburbs that are rated as car dependent.

What does all this mean on the ground?

  • BramptonZumandGO

    Brampton’s GO rail station is on an elevated track behind this office building, and has a bus loop for Züm and GO buses.

    First, these data mask a lot of local variations. There are unquestionably pockets of high walkability in the outer suburbs – the centre of Whitby, the town of Markham, Unionville, old Richmond Hill, downtown Brampton with its pedestrianized area around the Rose Theatre and the integrated GO train station and bus station just off Main Street, Erin Mills, Port Credit, Oakville and Burlington.

  • MissaugaCentreTerminal

    Mississauga Centre Terminal is awkwardly situated above Square One mall, which is to the right on a lower level, and across the street from the GO bus station, which is to the left of this photo.

    York Region terminal at Lansing/Richmond Hill

    York Region terminal at Lansing/Richmond Hill, next to a Cineplex and a mall, but at arm’s length

    Second, there are indications of nascent mobility hubs, such as Downtown Markham, the new James Street station in Hamilton, but the standard practice of the regional and municipal transit authorities has been to built terminals adjacent to but at arms length from shopping malls – close but not integrated. This is the case at Pickering Town Centre and at Square One in Mississauga. Malls may be destinations but these terminals are currently sterile, windy, places. To work well the bus terminals need to be part the building. And for mobility centres to work well they need to integrate as many uses as possible – residential, retail, colleges, workplaces, small urban spaces, not just to have some high density housing around them.

  • AjaxGO

    GO train station at Ajax, with Durham Region bus terminal and convenience stores. The bus is wrapped in an ad for for a local car dealership. GO train stations provide free parking, and several, including Ajax, Pickering, Whitby, Oakville and Burlington have multi-storey parking structures.

    Third, I am impressed by some of the GO railway stations on the Lakeshore line that have combined large parking structures with bus loops, child care centres, cafes and convenience stores.

  • Fourth, as Marcus Gee points out in his article, the outer municipalities are actively engaged in major improvements to their transit, specifically the implementation of bus rapid transit. Even Halton (which has a minimal system at the moment) is contemplating a bus rapid transit lane along Hwy 5. York Region’s rapidway Viva system and Miway’s transitway are remarkable experiments in changing travel habits. And they have been implemented at the very time that Toronto’s politicians have been caught up in ideological disputes about transit city, subway extensions, and smart track. There is a long way to go, but I see them as part of the early stages of a remaking of suburban urban forms and travel patterns.

    BuildSubways

    A moment in the City of Toronto’s ideological conflicts over transit. This sign was at Sheppard and Kennedy in Scarborough in early 2014.

• Maps of Sources of Immigration to Toronto region pre 1941-2005

The Toronto Star has an excellent interactive time series of maps showing the different countries and regions of the world from which people immigrated to Toronto from before 1941 to 2005, based on Census of Canada data.  Here I have clipped what I think are some key maps from the video sequence that illustrate the broad patterns of immigration both by region of origin and by areas of settlement in the region.  Because they are screen captures the sliders and other interactive features do not work, but I think this static version allows the patterns to stand out. I have also added a few comments and a couple of other related pieces about immigration.

These maps show the broad patterns, but miss the remarkable variety of the origins of immigrants to the Toronto region.  You can get that by going to the Toronto Star site and tracking immigration from over 120 different countries to the Toronto region.

pre1941immweb

Immigration before 1941 was mostly from the UK, and immigrants settled throughout the Toronto region.

1941-50immweb

Immigration 1941-1950, which obviously occurred mostly in the years after the war, was again mostly from the UK but also substantial numbers from Germany, Poland, Estonia, Latvia and Lithuania.

1951-60web

Immigration 1951-60 saw a change. Immigration from western and northern Europe continued, but was supplemented by a wave of immigration from Italy, which was concentrated in a corridor running northwest from downtown along Bathurst into the area around Woodbridge. Italian immigration continued through the 1960s and declined rapidly in the 1970s.

1961-70web

Immigration 1961-70 continued the pattern of the previous decade, with the dispersed settlement of immigrants from the UK, substantial numbers from Southern Europe – mostly Italy concentrated in the Bathurst corridord, but also some from Portugal. Immigration from the Caribbean and East Asia began on a small scale. 

1971-80web

Immigration 1971-1980 included many from Portugal who settled just east of downtown in what came to be called Portuguese Village, and increasing numbers from China and India (especially in the northern part of Metro, Markham, and in Mississauga and Brampton), and from the Caribbean (in norther Scarborough, Brampton and the north-west part of Metro). Immigration from South Asia began.

1981-90web

Immigration 1981-90 reinforced the changes that had begun in the previous decade with intensified immigration from China and India. Immigration from Portugal began to decline and from Eastern Europe began to increase. The wave of immigration from Vietnam that had begun in the 1970s was especially concentrated in the 1980s.  UK immigrants declined substantially. The majority of new immigrants from the Caribbean and Asia settled in the inner and outer suburbs.

1991-95web

Immigration 1991-1995 was primarily from East and South Asia, and from Eastern Europe – primarily Russia. Immigration from Central and South America was concentrated in the north-west part of Metro, from China in northern Scarborough, Markham and Richmond Hill, and from India and Pakistan in Brampton, Mississauga and Scarborough. 

1996-2001web

Immigration 1996-2000 continued the same pattern as the previous half decade with the addition of a wave of immigrants from the Philippines. 

2001-2006web

Immigration 2001-2005 – again the pattern of the previous decade with the majority of immigration from South and East Asia, and from Eastern Europe continued and intensified.

The consequence of the diverse sources of immigration is a region where a wide range of languages other than English or French are spoken at home that is captured in this map of the “Language Quilt” (based on 2006 census data) The original is also from the Toronto Star, but I clipped this from Bricoleur Urbanism which processed a massive file into something “more digestible” (scroll down until you get to it).  There it is noted that English was the second language in 2006 in Brampton (to Punjabi), Markham (to Chinese), and Woodbridge (to Italian). There are also details about languages that will shape regional patterns in the future – Urdu, Chinese (because Cantonese or Mandarin is not specified in the Census response), Punjabi, Mandarin, Tagalog, Russian, Farsi and Spanish.

Languagequiltweb


Finally, a reference to article on “Toronto’s Ethnic Buffet” from the New York Times (that I read the day I posted this – 2 March 2014) that celebrates the cultural diversity of Toronto and offers a welcome reminder by an outsider that the constant silly distractions associated with the City of Toronto’s current quasi-Mayor Rob Ford are in no way representative of the city (who, thankfully, the author Francine Post does not mention. She does say, incidentally, that there are at least three Chinatowns in the Toronto metropolitan area, but the actual number is closer to ten.)

• Maps of the urban growth of the City of Toronto (Feb 2014)

I have just come upon an intriguing short timeline video of the growth of the built up area of the City of Toronto from 1901-2002.  This was presented at a planning roundtable on The Shape of the Suburbs in Fall 2013, and it was posted here on YouTube, but has had few viewings – a little over a hundred. I think it warrants more attention than that, and also a somewhat slower means of digesting what the video shows, so I have clipped the maps for each decade (1901, 1911 etc – the years of the Canadian census). Here they are, with a few comments – they all enlarge if you click on them.

1901


Note that this shows some large areas “built” in the north-east corner – I assume these were farms – some of which are still there in the one rural corner of the City that is now the Rouge Park. The base map is a current one – Highway 401 and the Don Valley Parkway are shown for reference, and many of the arterial roads shown here were only opened all the way after 1950.

1911

1921

The 1911 and 1921 maps show the growth of the streetcar city as the electric streetcars pushed east and west of the downtown core, and north along Yonge Street. The large orange patches are, I believe, large estates, now mostly parkland in Sunnybrook and Highland Creek.

1931 1941

The built-up area in 1931 corresponded closely to the boundaries of the old, pre-1998 City of Toronto.  There was little change in the Depression years between 1931and 1941.

1951

The blue patches are the harbingers of the much more extensive automobile-oriented suburban growth that was to come. Many of them in 1951 were small clusters of little houses – a little over 1000 square feet, bungalows or story and a half. This was before either Metro or effective planning were in place, and they were scattered throughout the townships that surrounded the old City of Toronto.

1961

This captures the beginning of the great outward surge of the post-war decades. Don Mills is a partial circle just to the right of centre. One of the probable consequences of Metro planning is that the new growth was mostly at the edge of the previously built area – no more scattered and isolated little development, but substantial subdivisions. The large solid blue patches just north of Hwy 401 are Downsview Airfield and parkland (and, I think, the cemetery just west of downtown North York). High Park is also shown as a large blue patch (this is a minor problem with this sort of computer generated mapping – one new building in a park means the whole patch is covered because that is how the data are coded).

1971

By 1971 what was then Metro Toronto was mostly full and urban development was beginning to spill over its boundaries to the west and the north.  The remaining areas of Metro, mostly in Scarborough in the north-east, would be built up over the next 30 years.  I think 1971 was when Toronto began its transformation to a post-suburban city because it was already becoming clear that unless Metro’s boundaries were expanded conventional suburban growth had a relatively short future.

1981

The white areas on the edge of Metro have almost disappeared, and if you look carefully at, for instance the Don Valley,  you can see evidence of infilling.

1991


2001

The subway lines and Scarborough Rapid Transit have been added to the 2001 map, though they were actually built at various dates between 1950 and 2010. Otherwise there was not a lot of obvious change from 1991. This map conveys very well the overall urban structure of the built-up area of Toronto – the old streetcar city in browns and yellows, the bands of post-war suburban growth, and also small areas of renewal and infill, in blues and greens. Unshaded areas are not patches available for development. They are a combination of ravines and parks (the Don Valley most obviously), the hydro corridors that cut diagonally through built-up areas like Haussmann avenues, the railroad yard in Agincourt, some industrial areas in the north and west parts of the city, and university campuses (both the University of Toronto and York University are unshaded).

• Condominium Apartment Skyscrapers in Downtown Toronto (Feb 2014)

aKingWestweb

Restaurant Row on King St West, site of a proposed 47 story condo that should preserve the restaurant facades but will dramatically change their context.

When I led a field trip for the Society of City and Regional Planning Historians in October through the west side of downtown, a sort condo feeding frenzy was underway – new towers dwarfing ones only fifteen years old, cranes everywhere, and rezoning signs on King Street both for the popular restaurant row on and for three 80+ story skyscrapers in the theatre block.  I wrote about Toronto as a skyscraper city in Chapter 5 of my book, but things seemed to be moving into another dimension. I intended this post to be a brief update to capture some of these changes, but then I discovered that several sources I used in Chapter 5 have been recently updated and deep divisions of opinion about what is happening. The result is this rather long post about condo towers downtown, who lives in them, what the planning constraints are, and what problems they might have.

————

Pros and Cons

According to Emporis, an organization that monitors skyscraper construction around the world, in early 2014 Toronto currently has more skyscrapers over 100 meters (about 30 stories) under construction than any other city in the North America. There are proposals for ten towers over 70 stories (three of them designed by Frank Gehry at more than 80 stories) and for another eight over 60 stories. (Probably because these are designed by a celebrity architect, these have been enthusiastically endorsed by some Torontonians, but for Gehry’s critics the wavy, gauzy effect will reinforce the view that he is the world’s worst living architect.) These towers will add to about 200 skyscrapers already in the city, most of which are condominium apartments and are concentrated downtown.

bGehryproposal

Three proposed condominium towers over 80 stories designed by Frank Gehry on  the theatre block owned by David Mirvish on King St West. The proposal is currently under review.

Chris Atchison thinks that intensification and skyscrapers on this scale are highly beneficial to the city. Writing in the Globe and Mail in September 2013 under the headline “Supersized Skyscrapers: Win-Win Developments?” he claimed that: “Ultra-tall mixed used towers that offer breathtaking views to attract residents and investors alike allow developers to maximize land use and boost profit margins.” His view is apparently widely shared because developers continue to build and propose ultra-tall condos, and people keep buying the units in them. Marcus Gee has a rather different perspective – he thinks Toronto’s plans to focus intensification, even at levels he calls ‘hyperdensity’, are working well because they allow the far more extensive relatively low-density areas of Toronto to remain essentially unchanged.

Others, however, have serious doubts about what Adam Vaughan, the councillor for the area where high-rise development is currently most concentrated (and cited by Marcus Gee), calls “vertical sprawl.” Konrad Yakabuski, for example, thinks Toronto has “an unhealthy height obsession” and that super-tall condos are “a lipstick on a pig approach and show an almost total disregard for their surroundings.  Gehry’s proposed towers may have fancy cladding, but they are would be about twice the height of the recently completed LIghtbox condominiums and five times as tall as the former Metro Hall, both of which are on adjacent city blocks.

Brian Tuckey of the Building Industry and Land Development Association, cited here, raises the fact that almost all residential construction in Toronto is currently of high-rise condominiums, mostly with small units suitable only for singles or childless couples. He thinks the real housing demand is for what he calls “ground-related product,” in other words townhouses and houses and sees no end in sight for the rising cost of these because so few are being built. His argument is supported by the City’s background report on the 2011 Canadian Census which shows that in the previous five years Toronto’s population grew by 112,000, yet over 90 percent of the dwellings constructed to accommodate this increase were apartments.

And a CBC documentary in November 2013 called “The Condo Game” suggested that developers have little interest in the durability of their condo towers because they make their money as soon as the skyscrapers are turned over to condominium associations, which are ill-prepared to deal with deferred maintenance issues of skyscrapers that in 15 to 20 year may include complete recladding of the fully glazed towers currently in fashion and/or replacing aging elevators, both of which will cost millions and disrupt the lives of residents for weeks. This February article in the Toronto Star makes a similar point about the costs of maintenance.


scondocraneswebThere is no doubt that skyscraper condos constitute a substantial change to the urban form and streets of the central city, but I have found most of the articles about them strong on opinions and short on evidence about this conflation of skyscraper building, condominiumization, intensification and population growth in downtown. This post summarizes information to some straightforward questions: What is downtown? What are condominiums and what particular challenges do skyscraper condos face? What are the trends for building apartment towers in Toronto? What is known about who lives downtown and the growth of population there? What are the planning guidelines for tall buildings?

Downtown Toronto

Downtown is where skyscrapers, whether offices or condos, the financial district and the major institutions are concentrated. There are some online discussions about the precise boundaries that take Bloor Street as the northern boundary, but the definition in Toronto’s Official Plan, shown below on the left, makes better sense both because it includes the tall buildings on both sides of that and because it is used in most City reports.  I note, however that the City’s “Guidelines for Tall Buildings Downtown” uses a subset of this that excludes the waterfront, the University of Toronto campus/Provincial legislature, and King-Parliament and King-Spadina – the areas where the condominiumization of downtown began and for which there are secondary plans. I also note that high-rise development is now spreading beyond the western boundary.

cdowntownfromOPweb

Downtown Toronto as defined in the Official Plan

cTallBuildingsmallerdowntownweb

A slightly modified version of Downtown Toronto, from Guidelines for Tall Buildings Downtown,

Condominiums

Condominiums are a form of collective living consisting of individually owned units in larger buildings. Some version of them is thought to have existed since at least the Romans, but they were not introduced to North America until 1960, specifically in Salt Lake City. In 1968 Ontario passed its first condominium act, and a revised version was passed in 1998 (currently under review). A condominium is a type of corporation, with a board of directors  elected from among the unit owners that has responsibilities for managing the condo’s budget with attention to the maintenance of common elements, including roofs, outside walls and windows, corridors, elevators, plumbing stacks, electrical rooms, parking areas, recreational facilities, lobbies and landscaping. Even though boards usually hire management companies to assist them, for a condo of several hundred units in a glass-walled skyscraper of 50 or more stories, and annual budgets of several million dollars, this is obviously a substantial responsibility,

dCondoscomingsoon-web copy

Near Bathurst and King, 2013

In 2013 more than a million people in Ontario were living in over 500,000 condominium units. In the City of Toronto about a quarter of all dwellings are condominiums. They can exist in many different forms, including townhouses and low-rise apartments, but data on construction for the City of Toronto for the last few years shows that more than 90 percent of dwellings completed have been apartments of five or more stories with the rest divided about equally between townhouses and detached houses.

eCondoraillandsweb

Concord Place Condominiums between Spadina and Bathurst

It has been suggested that the boom in skyscraper condominium apartments in dense urban centres is because condos now provide the only affordable way for most people to buy somewhere to live, and are the only affordable way for developers to build (though for developers I suspect that it may be more a matter of maximizing profits). In the Toronto region (the CMA) the number of condo completions has risen from about 6,000 in 2000 to 18,000 a year now, which is considered to be about the limit given the number of construction workers and amount of equipment available.  Real estate data specifically for the City of Toronto show that in 2013 13,797 condominium units were sold, the average price was $381,000, the average size was 796 square feet, 40 percent were one bedroom or one bed with den, and 42 percent had two bedrooms. Only 8 percent had three bedrooms, and the average price of those was $800,000.  This is significant because a three-bedroom dwelling is usually what is considered necessary for a family with two children, so apparently only wealthy families can afford condominium apartments in Toronto.

Skyscrapers and the Growth of High-Rise Living in Toronto

scollegeparkweb

Apartment skyscrapers at College and Bay

Definitions of skyscrapers vary considerably. One key source of international information, Emporis, uses 100 meters or more architectural height (not including antennae or spires – about 30 stories); by this measure the City of Toronto has 187 and ranks 7th globally. Skyscraperpage, another good source of international information, uses 12 stories or more (about 35m), the height of buildings to which the word ‘skyscraper’ was applied when it was coined in the late 19th century; by this measure Toronto has 1987 and ranks second in the world after New York City.

The Canadian Census and City of Toronto collect date for neither 100m nor 12 story buildings, but they do have information on apartment building of five or more stories. In 2011 the Census counted 1,048,000 dwellings in Toronto; 429,000 were in apartments of 5 or more stories (41%), 165,000 in apartments less than 5 stories (16%), 275,000 detached houses (26%), 116,000 semis or duplexes (11%), and 160,000 townhouses or row houses (15%).  With these proportions it’s not difficult to see why there might be concerns about the fact that 90% of dwellings constructed in the last few years have been condominiums.

Skyscraperpage includes a timeline of tall buildings built over the last 50 years (actually back to before 1900) and using this it is possible to trace the evolution of the skyscrapers in Toronto (I have a drawing of the changes to the downtown skyline in Chapter 5 of my book).

  • In 1960 there were about 25 buildings of 12 stories or more. The only buildings over 100m were Commerce Court, the Royal York, the old Bank of Nova Scotia building at King and Bay, and the tip of the tower of Old City Hall at 103.6m. None were residential.
  • By the end of 1970 41 towers of twelve or more stories had been added, including the first two towers of the Toronto Dominion Centre and New City Hall. Office towers were downtown but at least 20 were apartments (this may be an undercount because Skyscraperpage doesn’t seem to include Metro social housing) distributed across the city – in Forest Hill, the Annex, Jane Street, York Mills, Scarborough, etc. The two 44 story (130m) Leaside Towers overlooking the Don Valley were built in 1970. In the 1970s another 100 or so apartment towers were built across the city, mostly of 20-30 stories. Towers at Charles St West, Crescent Town, Harbour Square and Harbourside Apartments and Palace Pier were over 100m.
  • From 1980 to 2000 the high-rise apartment building surge dropped away and only about 30 high-rise apartment towers were completed, with just two over 40 stories.
  • A building surge began in 2000 with about 50 towers over 12 stories completed in the first 5 years of the new millennium, 20 of them over 100m. These were initially dispersed across the City, along the waterfront, in North York and elsewhere. The concentration in the downtown core began about 2005, and between 2005 and 2010 about 50 tower apartments were built, most of them downtown, 33 over 100m including 15 at more than 40 stories, and another at 6 at more than 50 stories,.
  • Since 2011, another 93 apartment towers over 100m have been completed or are under construction, the tallest at 78 stories (Aura at Yonge and Gerrard opened late 2013), a dozen over 50, 25 more over 40, again most of them downtown. There are currently proposals for 10 buildings over 70 stories, and another 8 over 60, all downtown.

In short, a skyscraper in 1914 in Toronto was a building with 12 stories or more, and there were fewer than 10 of those; none were residential. The tower of Old City Hall was the tallest structure in the skyline. Now there are almost 2000 buildings of 12 or more stories in Toronto, 187 of them over 100m.

  • –        in 2000 there were about ten residential towers of 100m or more in Toronto
  • –        in 2005 there were about 30,
  • –        in 2010 there were about 60
  • –        in 2014, including towers under construction, there are more than 150.

This may be confirming what seems obvious, but over the last ten years the rate of construction of skyscraper apartment towers has accelerated, the towers have become taller and, in marked contrast to the distributive practices that applied before 2005, they have been increasingly concentrated not just in downtown Toronto but in the core of downtown around the financial district and along the waterfront.

Who Lives Downtown?

A 2007 report by the City of Toronto titled Living Downtown indicated that the population of the central area had increased by 70,000 between 1976, when the Central Area Plan was made, and 2006. This growth number can be updated using information from the 2011 census in the City’s Ward Profiles (a ward is an area represented by a city councillor) for Wards 20, 27 and 28, which together correspond closely with downtown as it is defined in the Official Plan. Downtown population growth 2006-11 was about 46,000 and constituted 40% of the population growth for all the City of Toronto. To put it differently, downtown population in those five years grew from 176,000 to 222,000, a 25% increase – compared with a 4.5% increase for the whole City. In other words, population growth was highly concentrated downtown.

fTorontoWardsweb

Downtown Toronto corresponds closely with Wards 20, 27 and 28.

Living Downtown and in the Centres  is a 2012 update to the Living Downtown study that also considers the four urban growth centres that are identified in the province’s Growth Plan for the Greater Golden Horseshoe (specifically North York, Yonge/Eglinton, Scarborough and Etobicoke). It is based on a survey that had 5,199 responses, 1,300 of them from residents of downtown. From that and the City’s Ward Profiles the following information is available:

  • Half the downtown population lives in single person households and almost half is aged between 20 and 40, about twice the City average
  • 60% of downtown residents are university graduates and almost 20% of the households surveyed have incomes greater than $150,000
  • 60% of dwelling units are bachelor or 1 bedroom

The 2012 report asked how far residents had moved from their previous dwelling and the conclusions are revealing:

  • 11% had moved within the same building, 33% had moved from another location in downtown, 30% from elsewhere in the City, 13% came from the GTHA and 12% from elsewhere in Canada
  • 55% of downtown residents had moved less than about 5 kilometers, and 70% had moved less than10 kilometers from their previous dwellings

The graph and map below from “Living Downtown and in the Centres” that clearly illustrate the relatively short distances downtown residents had moved.  They suggest that the substantial population growth downtown does not involve a migration from the suburbs so much as a churning of population within and close to downtown.  gDistance-moved-in-downtownwebhMap-of-downtown-movesweb


The survey for ‘Living Downtown and in the Centres’ identified problems of living in the central city as:

  • Car traffic/congestion (21%)
  • Noise (14%)
  • Affordability (13%)
  • Homeless people (8%)
  • Too few parks (7%)
  • Pollution (6%)
  • Transit problems (5%).

The survey also found that most of the downtown respondents feel cramped in their current apartments because 25% of them hope to move to larger dwellings of some sort, though only 14% expect to move out of downtown. Given the small size of most of the apartments downtown and the fact that so few houses and townhouses are being built anywhere in the City, this appears to be wishful thinking.

Planning for Tall Buildings Downtown

Toronto has both city-wide guidelines for tall buildings and specific guidelines for tall-buildings downtown that were updated in 2013.

iHeritageTallBuildingweb

Illustration from Downtown Tall Buildings, showing heritage protection in relation to skyscraper construction

The city-wide guidelines discourage slabs (because they cast big shadows), and free standing towers surrounded by open space (the standard practice from about 1955 to the 1980s). They aim to minimize adverse wind conditions by using design features such as step backs and canopies to reduce downdrafts.  They require transitions to lower-scale areas, and they require towers to be located and designed to respect the scale and form of on-site and adjacent heritage properties. The minimum tower separation is 25 meters, and this is increased for taller towers.  An important aim is to relate tall buildings to streets: “A well-designed and vibrant streetscape is vital to the character and quality of the tall building site and the surrounding public realm, as well as the livability of the city” (page 58).

qLowerSpadinaweb

This view of lower Spadina Avenue shows the difficulty of achieving a semblance of a conventional streetscape in an area of skyscraper condos.

The guidelines for “Downtown Tall Buildings” stresses the fact that this is an urban growth centre in the provincial Growth Plan and high-rise development is needed to meet the density goals of that regional plan. The Toronto Official Plan gives no overall height and density limits for downtown – they exist only where they have been determined on the basis of area reviews.  The core area around King and Bay west to Spadina has no limits.

The specific aim downtown is to fit new development with existing and planned contexts in order to achieve compatibility with other buildings, public spaces, streets and “lower scale neighbourhoods.” There are several heritage districts and many individual designated buildings downtown and the guidelines stress the importance of protecting these and low-rise neighbourhoods by stepping the towers well back behind them.

jTransitionandspacesweb

Diagram from Downtown Tall Buildings showing various guidelines for spacing skyscrapers and relating them to existing development and streets.

To achieve these aims the guidelines for downtown tall buildings distinguish:

  • High Streets (some sort of pun, I suppose) – major downtown streets suitable for tall buildings
  • Secondary High Streets that run between or adjacent to High Streets, and have mostly residential apartment buildings, where tall buildings are also appropriate
kHighStreetsweb

Map of High Streets from Downtown Tall Buildings. High Streets in blue, Secondary High Streets in pink.  Incidentally, this illustrates the awkwardness of excluding areas with Secondary Plans that are shown in grey.

Three street forms for High Streets are identified –

  • Tower base forms = slender point towers on “pedestrian-scaled base buildings” or podiums that define the street edge
  • Canyon forms–street walls with tall buildings that cover the full width of the lot
  • Landscape set back form – mostly to preserve heritage buildings – where the tower is set further back from the street.
ldowntown-vision-height-mapweb

Downtown Vision Height Map from Tall Buildings Downtown shows suggested height limits for High Streets. The pale yellow area (the financial district) has no height limits. Yonge Street is a special study area, which in practice seems to mean that very tall towers can be built along it as long as they keep a bit of the facade of old low rise commercial buildings. 

A key aim of planning is to direct urban change so that deleterious environmental and social effects are reduced, and the tall building guidelines are a commendable effort to control a rapidly changing development phenomenon by maintaining a semblance of pedestrian friendly forms at street level. Yet even though they were updated in 2013, I have they impression they are playing catch-up. Most of the photos in the guidelines are of towers that already seem rather modest.  The downtown Vision Height Map seems to give no indication of the 78 story Aura tower at Yonge just south of College that has just been completed, and  proposals for 80 story towers by Frank Gehry and others at the foot of Yonge Street are both out of the area it covers.  The Gehry proposal was turned back for review in December because, according to Chief Planner Jennifer Keesmat, it lacked a meaningful heritage strategy, it size and orientation were inappropriate, it lacked  private amenity space, and made no contribution to community facilities, all issues clearly addressed in the tall building guidelines. This suggests that downtown is becoming a sort of playground for condominium developers trying to get away with whatever they can.

COMMENTARY

It is clear that the downtown skyscraper condo boom is a recent phenomenon that began only about ten years ago and that it is a demographic, geographic and architectural deviation from all previous urban development practices in Toronto.

nTowersoverYorkvilleweb

Glassy skyscrapers (one is a hotel) towering over what street signs call the Village of Yorkville demonstrate the remarkable change in urban form that is underway.

Recent high-rise condominium construction has brought population to the parts of downtown close to the financial district, it has been a huge factor in the City’s recent population increases, and has enabled the City to meet the targets of the Growth Plan for the Greater Golden Horseshoe which identifies downtown as the most dense urban growth centre in the region. But it would be unwise to ignore concerns about the types of buildings, future responsibilities of condominium associations, and the limited number of families that are being accommodated downtown. For instance:

  •  Many recent condominiums towers are sheathed in windows – in part for design but probably also because glass is a relatively inexpensive building material.  The Tall Building Guidelines encourage sustainable design and green building performance, but fully glazed walls are thermally inefficient, and inclined to leak.
  • The tower renewal programme currently underway in the Greater Golden Horseshoe, which aims to retrofit and repair towers, almost all under 30 stories, built in the 60s and 70s, gives a good indication of the long-term problems of maintaining high-rise apartments. The CBC’s Condo Game documentary noted that for glassy condo towers there is a significant possibility that seals and caulking will begin to fail after 15-20 years, the cladding will have to be replaced, and owners will have to move out while this is being done because their units will be without an exterior wall. The costs of recladding will be many millions of dollars even for relatively modest towers, and if these costs have not been covered by setting aside large reserve funds high special assessments will be needed to pay for them. It is not impossible that this could cause problems on a scale comparable to that of the leaking condos in British Columbia in the 1990s .
  • The Living Downtown surveys indicate that the owners of these new condominiums are mostly relatively young.  While they indicate a desire to stay downtown they also want more space in their units, and if they have families they will certainly need that.  However, very few new dwellings being built anywhere in the city that they could move to. The fact that 90% of new dwellings in Toronto are apartments, almost all in towers, represents a very substantial deviation from previous practice. It is possible to accommodate families in high-rise development – it has been achieved in Yaletown in Vancouver – but this requires some larger, affordable units, and neighbourhood schools and playgrounds which so far have been part of the recent skyscraper boom downtown.

    qyaletown-copyweb

    Skyscraper apartments and recreational facilities in Yaletown, Vancouver, offer an alternative model for intensification that is better suited for families that the current downtown towers in Toronto.

  • Yaletown has been successful in providing facilities for families in large part because of major revisions to the BC condominium legislation following the leaky condo crisis.  It is to be hoped that the current review of Ontario’s condominium legislation will attend to the the accommodation of families and to the possible problems of glass-wall skyscraper construction. 
  • The condo boom downtown began in the late 1990s with the dezoning of King-Parliament and King-Spadina industrial/commercial areas (discussed in Chapter 5 in my book on Toronto). The intent was to relax land use constraints yet maintain existing built forms, so the first condos were modest buildings of 10 to 20 stories, such as the one shown below. My impression is that the Guidelines for Tall Buildings make excellent sense for that sort of scale, but at 70 and 80 stories the canyons and peaks are at an entirely different order of magnitude. Heritage preservation of three story brick buildings in a cityscape of 80 story glass towers really does seem like a lipstick on a pig approach.
mRichmondSpadinaweb

The corner of KIng and Spadina. The twelve story tower just behind the brick building is a condominium completed about 2001, consistent with the initial aims following dezoning of fitting new building with older urban forms. In the background are several recent skyscraper condominiums.

Finally, I am far from convinced that these super-tall skyscraper condominiums are the only or best way to achieve the high densities demanded in the provincial Growth Plan or as way to reduce pressure on transit because people can walk to work in offices in the central city. Here are my reasons:

  • The Growth Plan density targets are for jobs+people, and the CBD is currently going through a boom in office construction.  In late 2013 a quarter of all the office space under construction in Canada was in downtown Toronto and the new jobs created will offset the number of people needed to meet the target.
  • Ward Profiles for the City include summary information on density and on number of apartments in buildings of five stories or more, apartments in buildings of less than five stories, and on number of houses. Ward 20, which includes the west side of downtown where the population rose from 49,000 in 2001 to 76,600 in 2011, is the ground-zero of condominium skyscraper constructions and proposals. It has 51% of the population in one-person households, 64% living in apartments of 5 stories or more. The population density is 10,270 per square kilometer (the highest in the city). Ward 14 is Parkdale, an area mostly of late-19th century streets, has only 40% of its population in apartments of 5 or more stories (and almost none of the really tall ones), 36% in apartments of less than 5 stories, and 25% in houses or row houses. It has a density of 9,490 per square kilometer (the second highest in the city).
  • St Lawrence Neighbourhood provides an excellent local model of intensification that has increased population close to the downtown core in ways that are both street and family friendly.

    qStLawrenceweb

    Low and mid-rise intensification of the St. Lawrence Neighbourhood. Many of the blocks have been redeveloped with apartment buildings of between 5 and 15 stories.

In the short-term, then, I think ultra-tall glassy condo towers promise glitz, glamour and convenience for their mostly thirty-something occupants who have moved from not very far away and can now walk to work and to clubs and restaurants. However, from a long-term perspective there are numerous reasons to doubt whether they will be beneficial contributions to sustainable urban forms that can be reasonably easily adapted to changing social, economic and environment conditions in ways that will maintain the organized complexity of the city of Toronto. But skyscraper condos are in fashion, and it seems probable they will continue to be the preferred approach to intensification downtown until the boom ends or there are no more sites to build on.


• The Size of Toronto relative to Canada and other Canadian Cities (Dec 2013)

The fact that the Toronto urban region has by far the largest concentration of population in Canada is both obvious and yet generally pushed into the background.

It is not that unusual to have one city that is dominant in a nation – London, Paris, Bangkok, Mexico City are all so-called “primate cities” that have more than twice the population of the next largest city.  Toronto is not yet twice as large as Montreal, but it is getting close.  But whereas London, Mexico City, Tokyo and other primate cities are national centres of attraction, Toronto seems to be regarded almost as a national and provincial embarrassment. The fact is that Toronto, because of its size if for no other reason, has a huge influence on almost everything Canadian – the economy, politics, culture, society.

Let me begin with some population numbers from the 2011 Canadian census, and below I will consider the relative significance of these.  A “population centre” in the Canadian census is defined as somewhere with a population of at least 1000 and a density of 400 or more people per square kilometre. The ones listed below are all the “large urban population centres” with over 100,000 people, plus three smaller ones that are in the Greater Golden Horseshoe and part of the Toronto urban region.

Toronto-Pop

Proportions and Relative Sizes

There’s one useful addition to the numbers above. The City of Toronto in 2011 had a population of 2.61 million. This amounted to:

  • 7.8% of Canada’s population
  • 20.4% of Ontario’s population
  • a population greater than that of all provinces except B.C., Alberta, Ontario and Quebec

The Toronto population centre in 2011 had:

  • 15.3% of Canada’s population
  • 40.0% of Ontario’s population
  • a population greater than that of all provinces except Ontario and Quebec

The combined population centres of the Greater Toronto and Hamilton Area in 2011 had:

  • 18.4% of Canada’s population
  • 48% of Ontario’s population

The combined large population centres of the Greater Golden Horseshoe in 2011 had:

  • 22% of Canada’s population
  • 57.5% of Ontario’s population

The overall 2011 population of the Greater Golden Horseshoe at 9.03 million was 27% of Canada’s and 70.5% of Ontario’s population, greater than all the provinces except Ontario.

However you define it, the Toronto urban region represents a remarkable concentration of population within Canada. This has several significant implications.

Implications

First, information about processes and trends in Canada as a whole, and especially in other parts of Canada, always has to be measured against what is happening in the Toronto region. For example, a story in the Globe and Mail 25 November 2013 titled “Canada’s population continues to flow westward”, noted that at 36,800 Alberta had a record number of immigrants in the previous years, and noted that rates of immigration to Ontario had declined. It did not mention that immigration to the Toronto region, though it had declined slightly from previous years, still exceeded 80,000.

Secondly, because much of Toronto’s rise in population relative to Montreal and other cities has occurred in the last fifty years, social and other changes that have intensified over this period are even more concentrated in Toronto than its share of overall population. The GTHA has about 18% of Canada’s population, but it has at least 37% of all immigrants (compared with 20% for Canada as a whole). The GTHA has 40% of all recent immigrants and 43% of visible minorities in Canada (compared with 16% for Canada as a whole). [NOTE: these proportions are based on the 2006 Census for the Toronto, Hamilton and Oshawa CMAs, the most recent census for which they are available.)

Thirdly, the concentration of population translates directly into political representation because federal ridings are revised (through a non-partisan process) after each decanal census so that each riding has about 111,000 people.  There are at present 308 federal ridings; Elections Canada indicates that following the 2011 census and in the next federal election there will be 338 ridings, 121 of which will be in Ontario, up from the current 106. About 60 of those will be in the GTHA, and 85 (or a quarter of all the ridings in Canada) in the Greater Golden Horseshoe. Of course, the politicians elected will represent different parties, but the point is that federal political representation is remarkably concentrated in one relatively small part of the country.

Fourthly, the concentration of population in Canada’s urban regions, especially Toronto, is out of synch with the Canadian constitution which regards all urban areas and municipalities as servants of the provinces. This issue is excellently discussed in a 2006 paper from the Library of the Parliament of Canada on “Municipalities, the Constitution and the Canadian Federal System”, and a 2013 report from the Canadian Federation of Municipalities on the “State of Canada’s Cities and Communities”. Their main concerns appear to be fiscal and the limited ways municipalities have to raise funds (mostly through property taxes), rather than constitutional, but the fact is that cities tend to be treated like irresponsible children by their self-righteous provincial parents, while the federal government looks on like a benign grandparent that occasionally gives out favours.  It’s not surprising that there have been intermittent appeals to make Toronto a province in its own right, for instance in Toronto: Considering Self-government (Ginger Press, 2000), to which Jane Jacobs contributed an introductory essay. I think I can say with considerable confidence that this is unlikely to happen anytime soon.

In the meantime the sheer mass of the Toronto urban region will continue to drag most of the rest of Canada behind it, like it or not and regardless of whether they are aware of it.  And even if rates of growth around Toronto begin to slow and those in current boom cities in other provinces, such as Calgary, begin to climb, simply arithmetic shows that it will take decades for this to have much impact.  A growth rate of 2% in the Toronto population centre amounts to about 100,000 more people a year, Calgary will have to grow at almost 10% to match this. In short, Toronto’s demographic dominance in Canada is not going to be challenged any time soon.

• Toronto’s Planning History (SACRPH presentation Oct 2013)

RelphCOVERweb
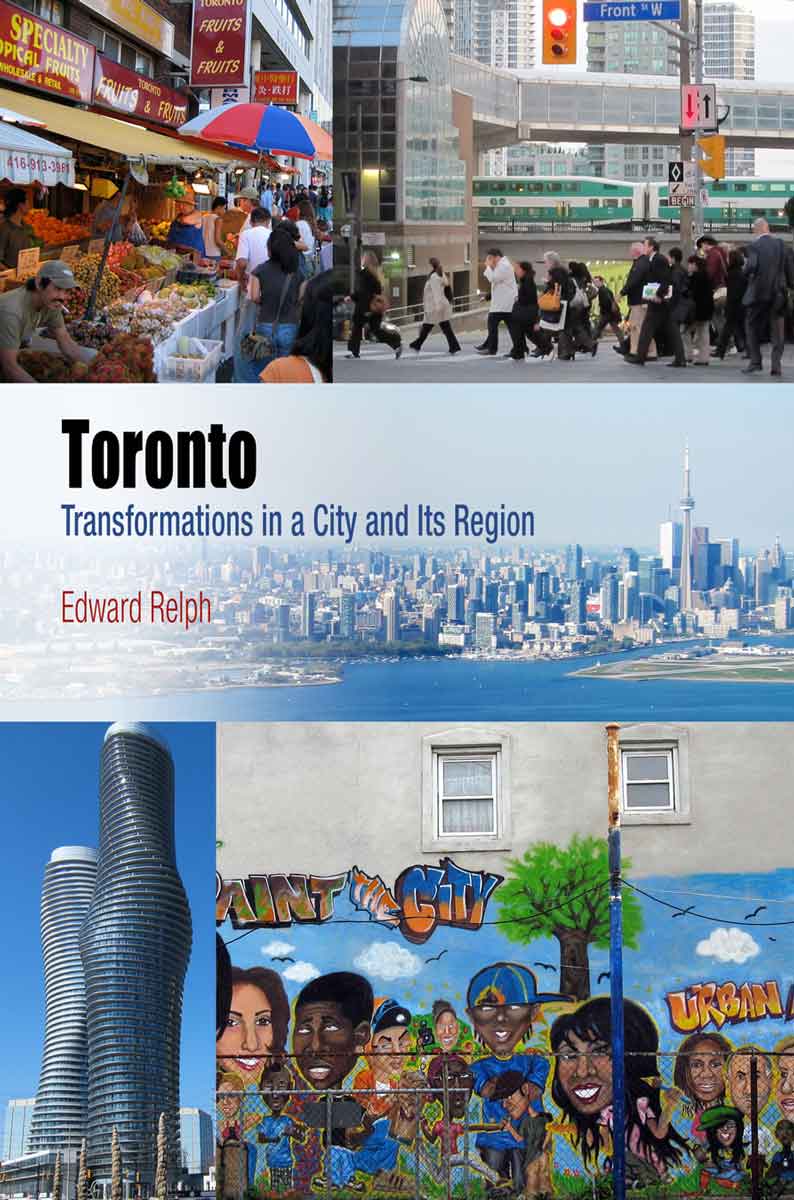
This is an expanded version of the presentation I gave on 4 October 2013 at the opening plenary session of the Society of City and Regional Planning Historians conference held in Toronto. Its purpose was to provide an overview of the planning history of Toronto in twenty minutes.  It is loosely based on material discussed in my book Toronto: Transformation in a City and its Region, published by the University of Pennsylvania press on the same day. My book and this website provide details that lie behind the overview I offered in my presentation.

Click on illustrations for larger versions.

The Geographical Context

1a.GoogleEarthGTHA-web
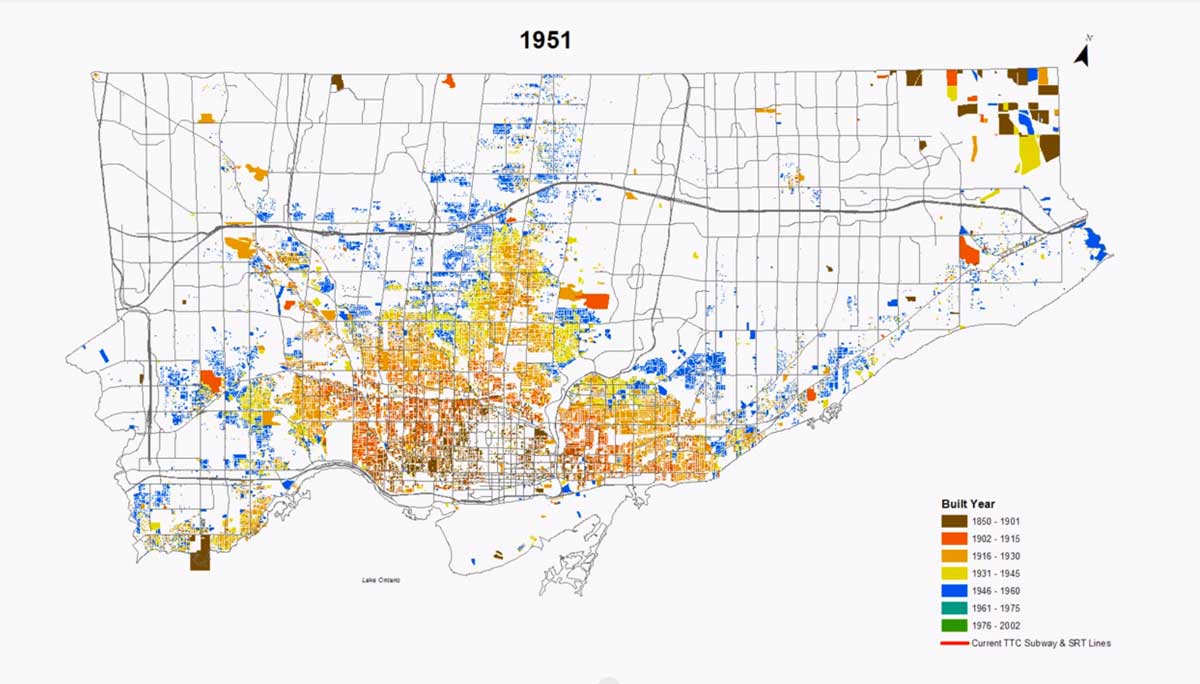
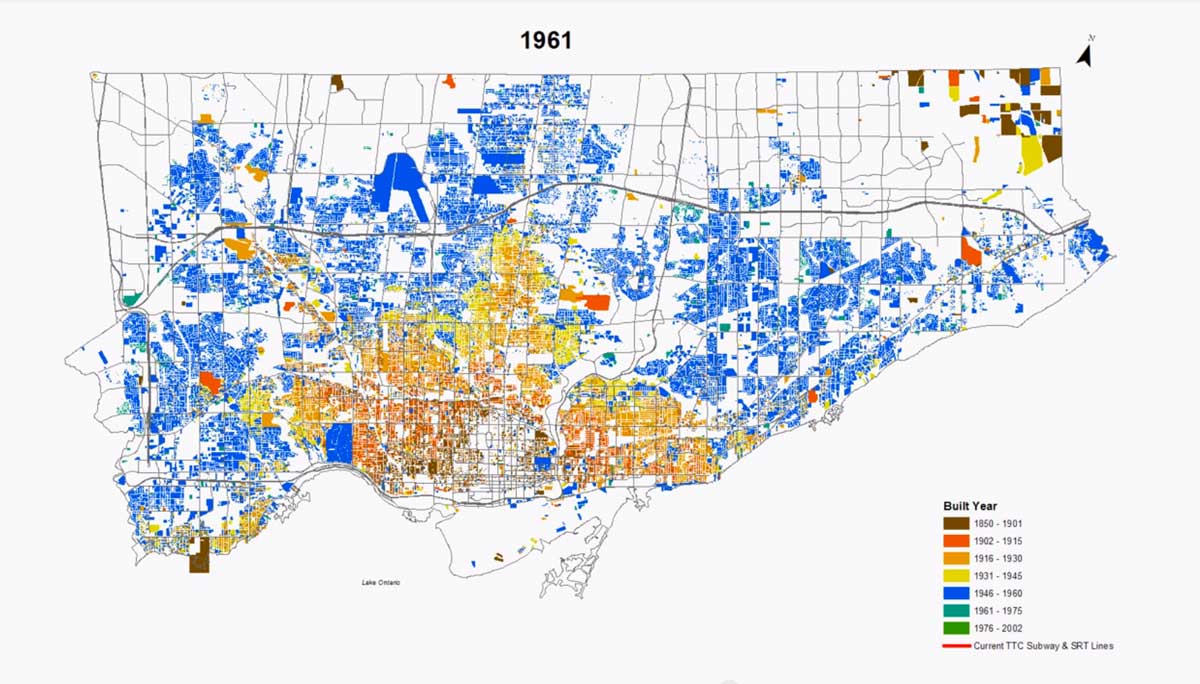
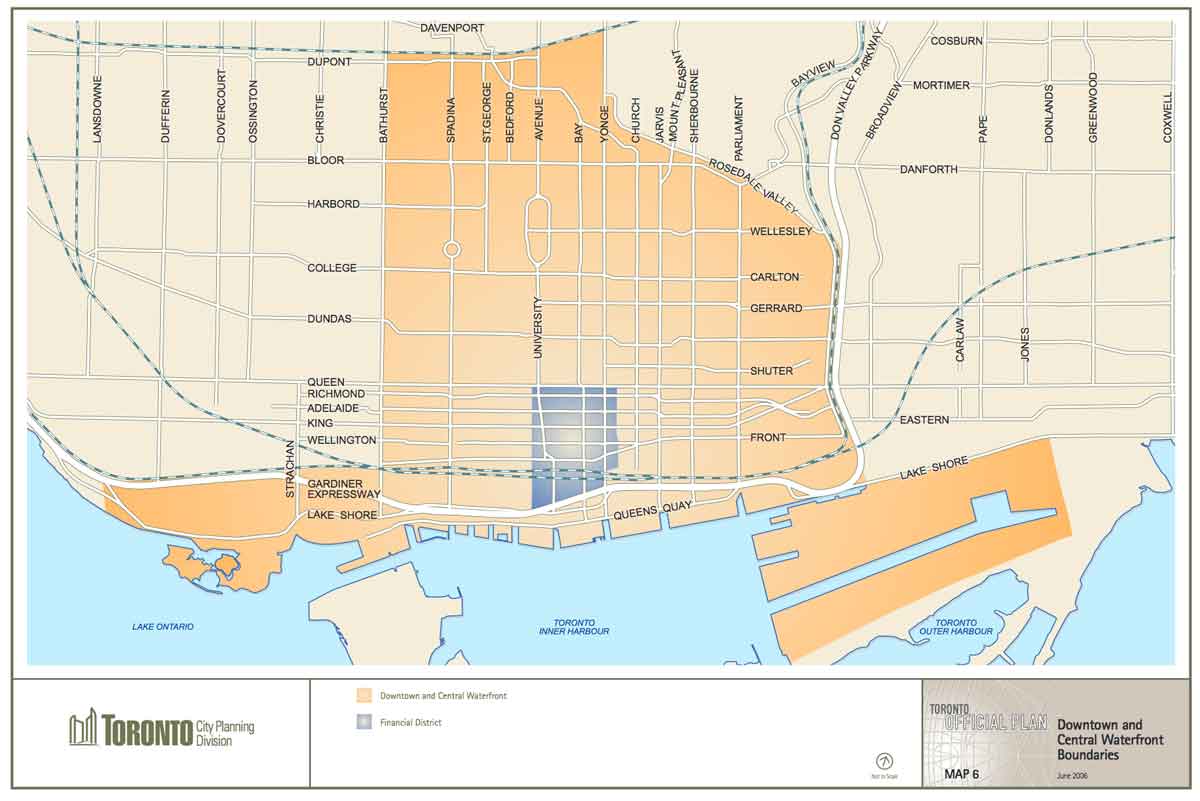
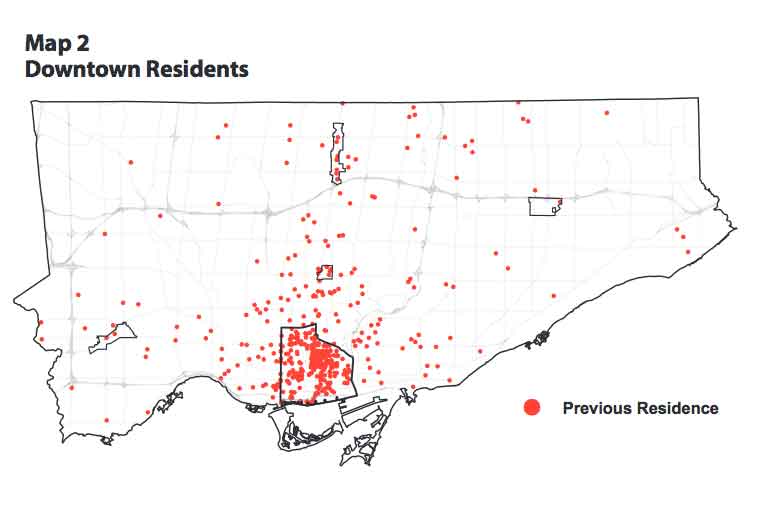
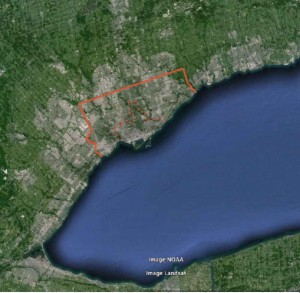
Some context is needed to make sense of my comments in this presentation. The red dotted line on this map shows the border of the old City of Toronto, the streetcar city that was built up by 1940. This no longer exists as a political entity even though for its citizens it remains a powerful reality, its urban landscapes are distinctive and it is widely admired for its street vitality and urbane qualities.  In 1998, against almost universal popular opposition, the Province of Ontario amalgamated the old City with the other municipalities in Metro Toronto (outlined with the solid red line) to create the (new) City of Toronto.

Between the border of the former old City (which has a population of about 650,000) and the new City (which has a population of about 2,600,000) are the inner suburbs. Outside the border of the new City are the outer suburbs. The grey on this Google image is the built-up or metropolitan area which has a population of about 6.6 million, which makes it the fifth largest metro in North America (after Mexico City, New York, Los Angeles and Chicago).

1. Unplanned Town 1793-1850: “A foul, disgusting, loathsome little capital” (Donald McLeod from Cleveland, 1841)

Toronto was founded in 1793 as a reaction to the American Revolution. The existing capital of Upper Canada at the mouth of the Niagara River on the south side of Lake Ontario, was too close to the Americans for comfort, and it was decided to move it here, where there was a protected harbour, hardly any native people, and endless forest. It might reasonably be expected that a new capital would warrant a small gesture in the town plan.  However, as the map below (made in 1818, for the Town of York because the name had been changed) indicates, there was nothing of note done by the city fathers – just some uncoordinated grids. The broad strip on the left shows the initial clearing for Spadina Ave, an act of vainglory by a private landowner, an avenue of trees that would lead to his house on a hill a couple of kilometres to the north, that was never completed. It was a remote, messy little town of which little remains except the street patterns. So my first observation is that there was in fact no planning worth the name in Toronto until the 1940s – no grand avenues as in Washington, no Olmsted parks as in Buffalo and Boston, no city beautiful districts as in Cleveland. This may have been the reason for McLeod’s reaction, which was shared by many other early visitors. (I note that another presentation at this conference, by Michael McLelland, argues that the Simcoe Plan – named for the Lieutenant Governor who founded Toronto in 1793 and includes the two grids shown on this map – did create a distinctive plan of squares and spaces. My interpretation is that these are elementary forms that constitute planning only in its most trivial sense.)

1bPhilpottsPlanofYork1818-web

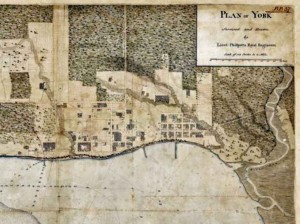
But note on this map the line of Yonge Street (named for the English Secretary of War) running north through the forest, and the northernmost east-west street, which is Queen Street. Queen was the base line and Yonge was the primary axis for a regional land survey that established the foundation for settlement in this part of Upper Canada.

Unplanned Industrial City: 1850-1940

2.1860mapweb
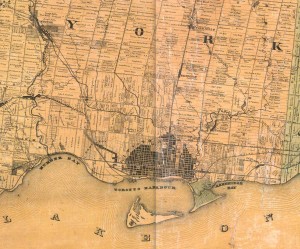
This map, made in 1860 (by which time the name had reverted to Toronto – York here refers to the County of York), shows how that regional survey had spread across the region as a megagrid of 1.25 mile squares, defined by side roads and concession roads.  Though it was intended as a way to create farms, this became and remains a matrix for urbanization, with the roads turned into arterials and the squares forming patches in a giant urban quilt. This could be considered planning, but it is only in the most minimal sense of the word – providing a structure without any clear goals.

The1860 map shows the first signs of industrialization – the railways that cut across the grid and along the lakeshore, separating the city from Lake Ontario, a problem still not fully resolved. Factories soon located near the railway lines, and by 1880 Toronto was a significant Great Lakes manufacturing city. It was committed to laissez-faire capitalism, the rivers and harbour were regarded as open sewers, and the city grew out in mini-grids intended to be efficient and profitable, packed with houses yet with the fewest possible civic amenities. Most parks, for instance, are small and were the result of bequests rather than generosity of spirit by Toronto’s politicians.

2aGooderham-web

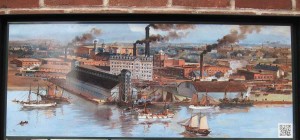
A bird’s-eye view of Gooderham and Worts distillery in the 1880s (now the Distillery District, a pedestrianized artist/tourist/heritage area), shows the smoking chimneys and air pollution that symbolized prosperity and progress in industrial Toronto.

An Accidental Success – Streetcar City 1870s-1930s

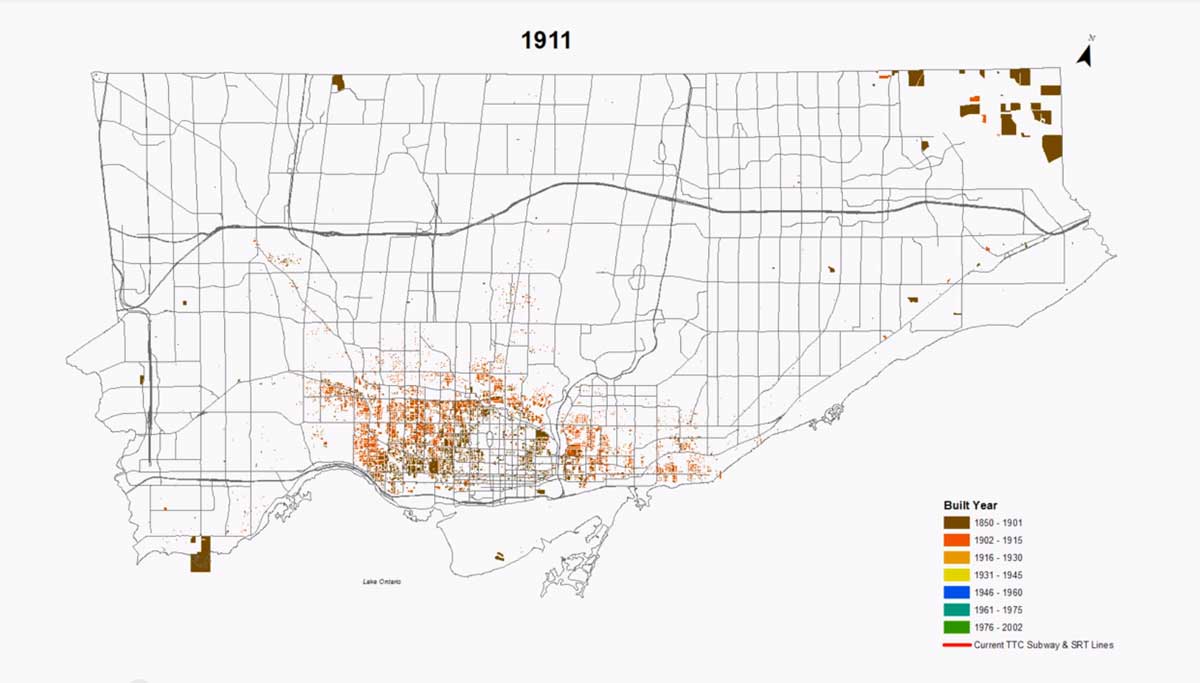
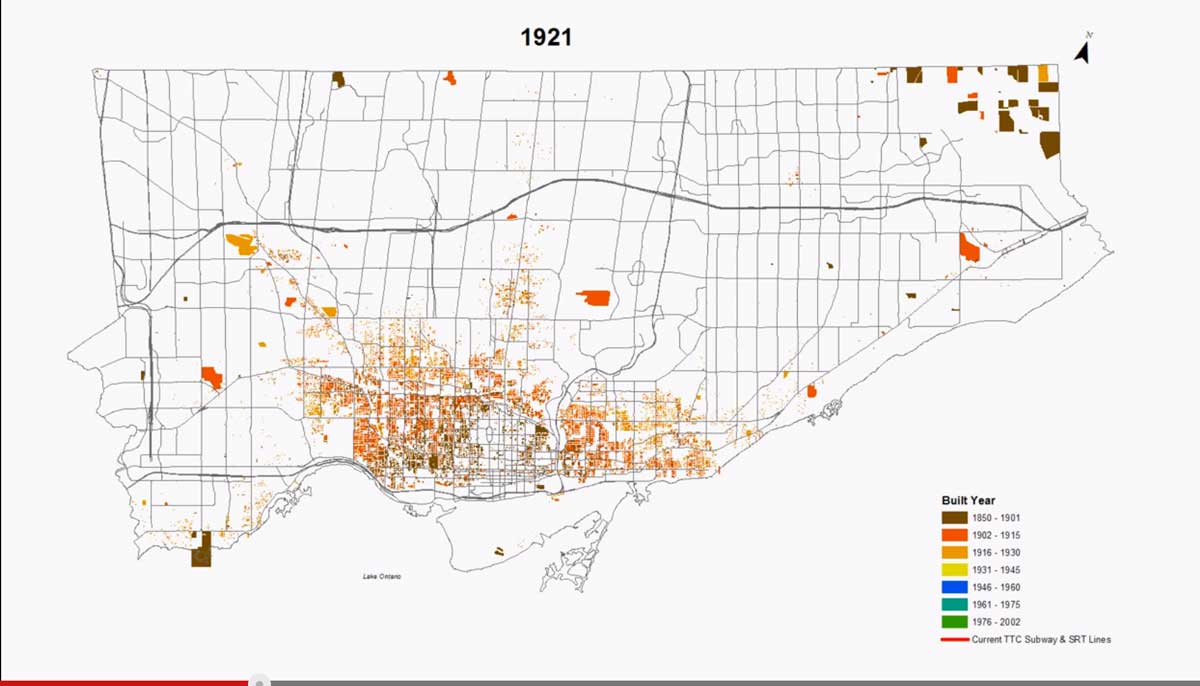
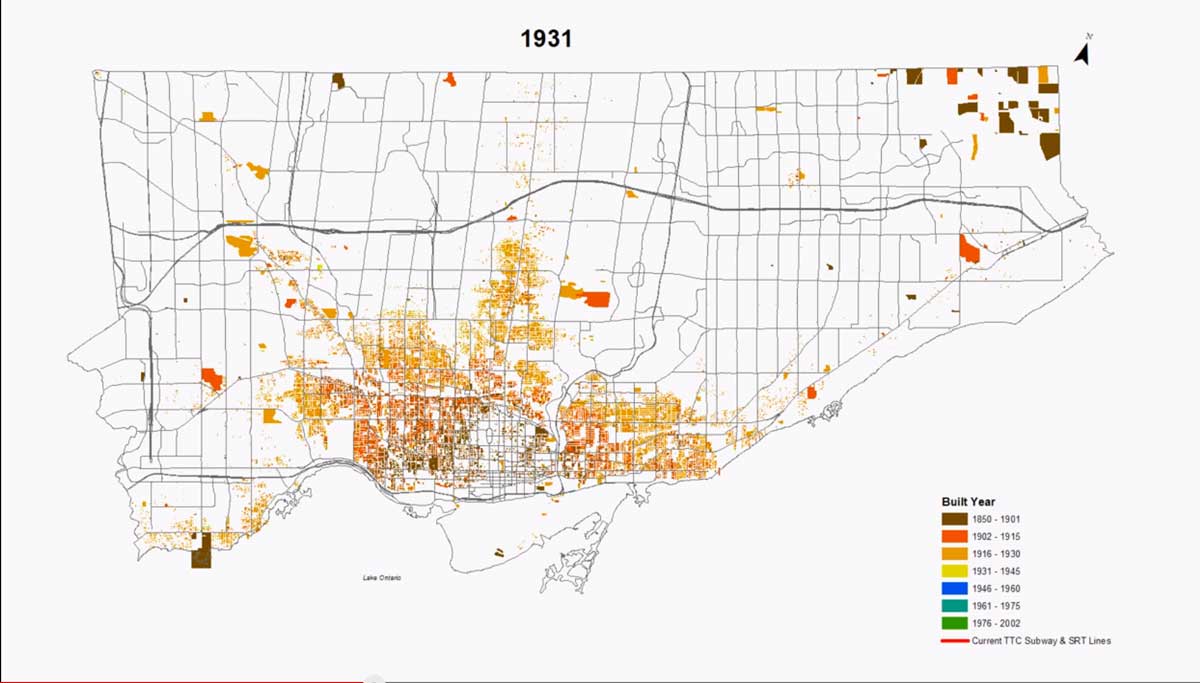
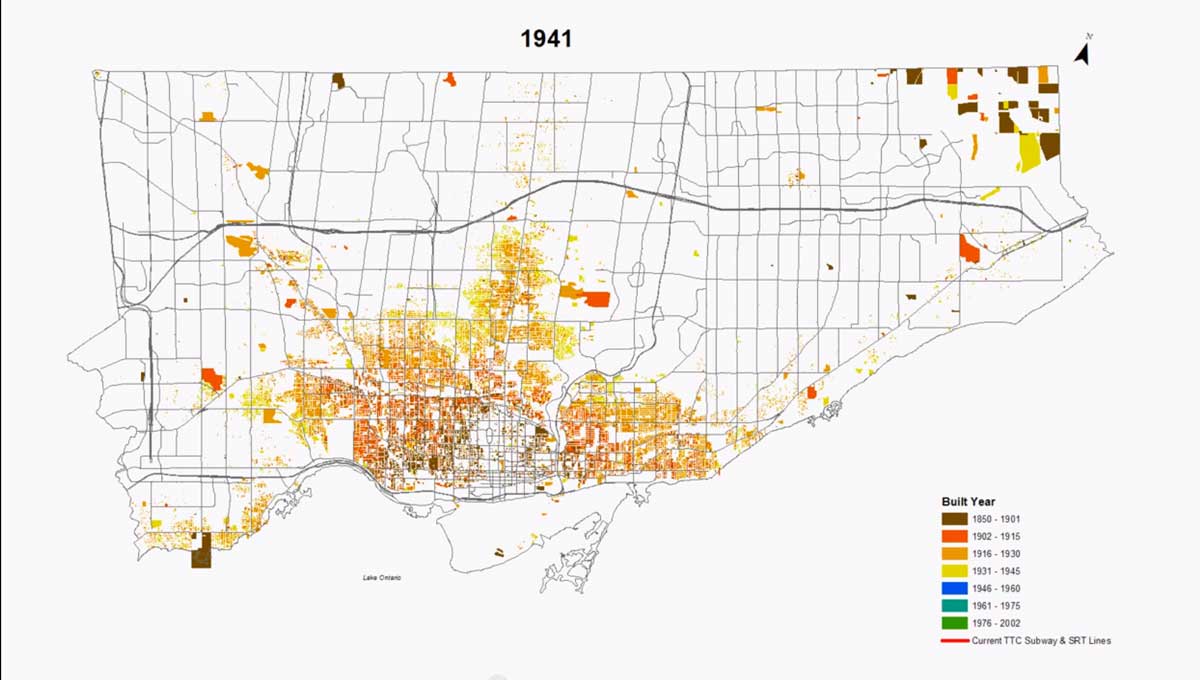
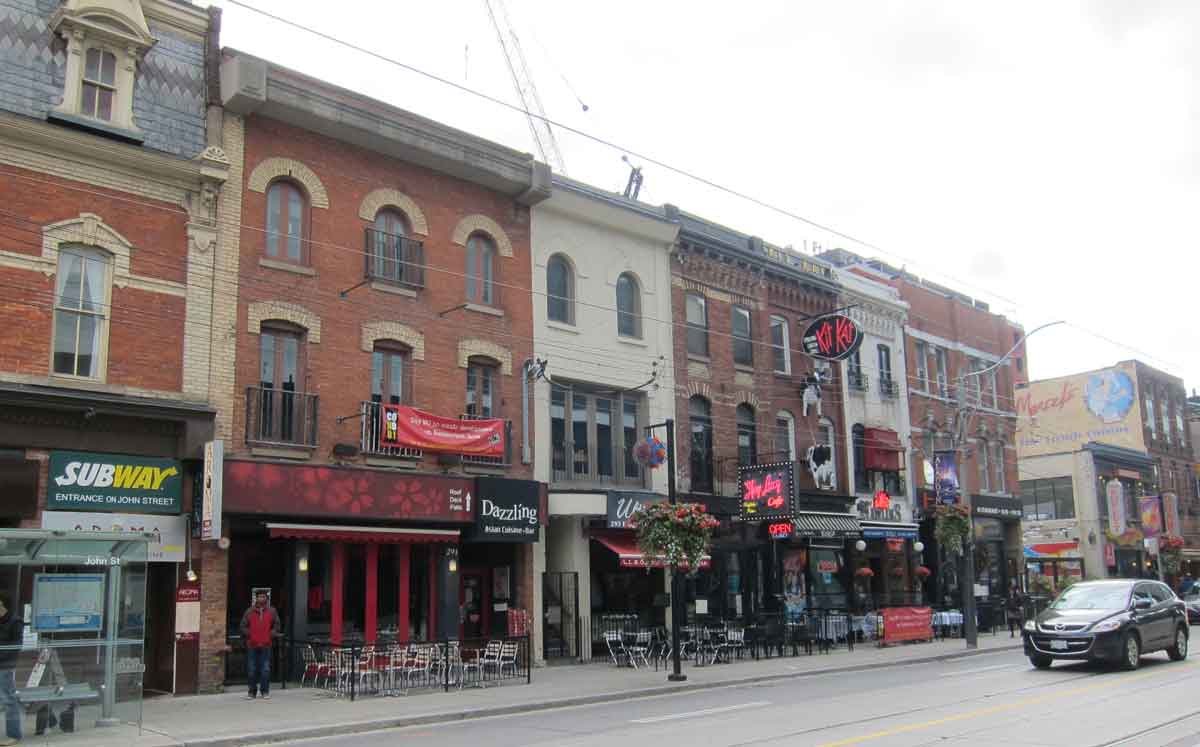
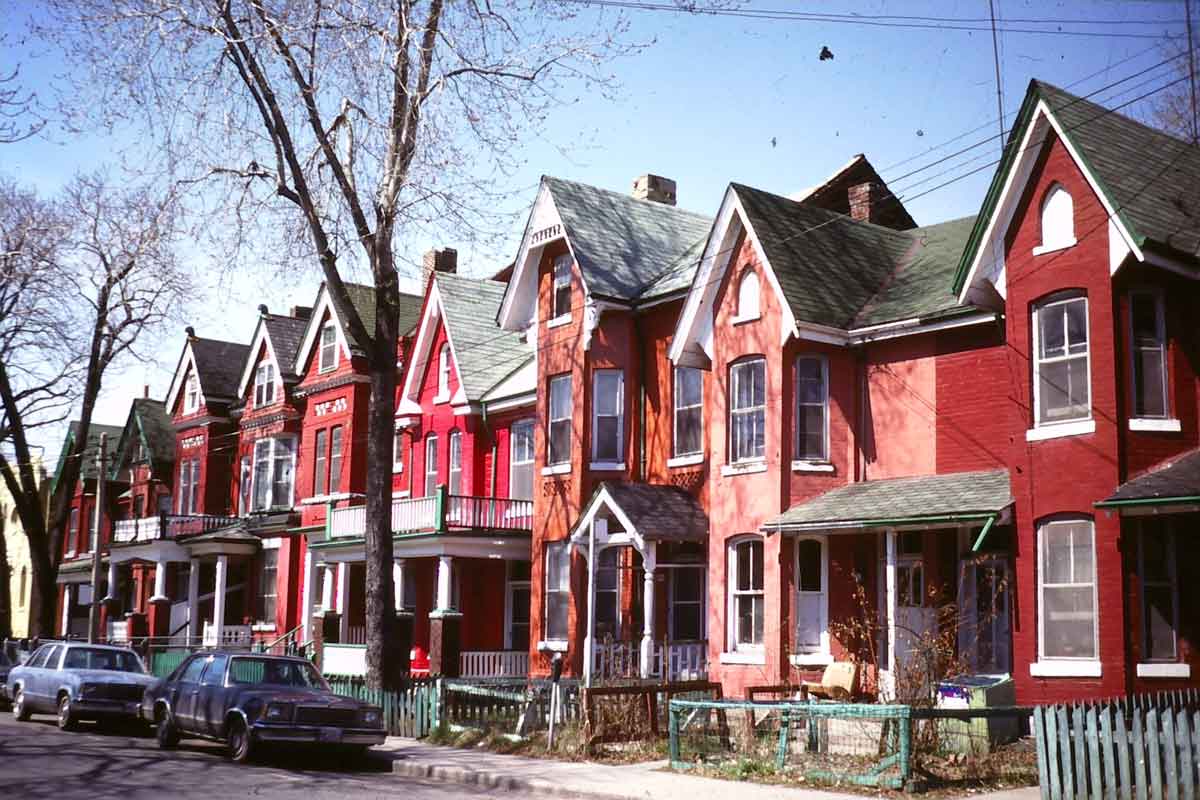
Industrial Toronto expanded in concert with streetcars and this created a distinctive urban form. My second comment is that even though that expansion of the industrial city occurred without any planning or forethought other than dividing it into profitable lots, the result is a streetcar city that has to be regarded as a great accidental success. The network of streetcar routes developed as continuous main streets, lined with commercial blocks of two and three storeys divided into shops with 20 or 40 frontages. Behind them densely packed houses lined mini-grids of residential streets within easy walking of the streetcar lines.  The styles and details changed, especially after 1900 with electrification and shifts in architectural fashions, but the basic urban form spread until the 1930s when the streetcar city of old Toronto was fully built-up to its borders.

2c.Parkdalestreetcar-web  2dTOBayandGable-web

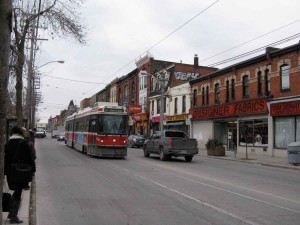
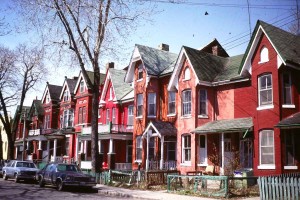
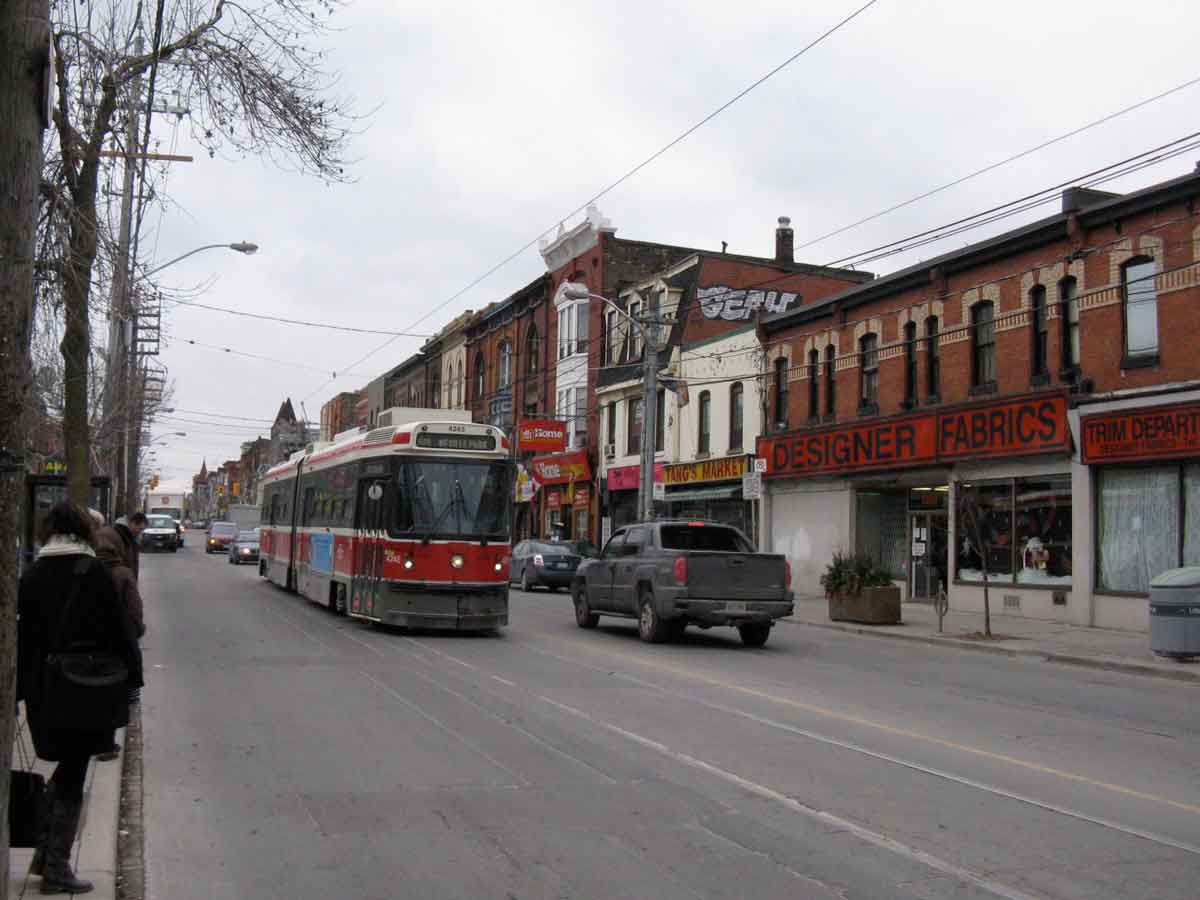
On the left is a typical streetcar main street (Queen West in Parkdale in 2010).  On the right at bay and gable streetcar houses – a distinctive Toronto style. Both date from the 1880s, and the buildings are brick because a by-law banning wood structures had been passed earlier in the century following a serious fire.

These streetcar urban forms have proved to be extremely adaptable and resilient, in some cases surviving to the present almost unchanged, and in many cases renovated, infilled and gentrified. They epitomize the current ideal of a pedestrian and transit oriented city. They are a major reason why Andres Duany claims that Toronto has more street-oriented retailing than all the sunbelt cities put together, and it was into a streetcar neighbourhood that Jane Jacobs chose to live when she moved to Toronto in 1968.

Planning Begins

From 1793 to 1940 what little formal planning there had been in Toronto was the work of private landowners, either laying out avenues such as Spadina and University leading to their buildings, or leaving a patch of land for a park (Grange Park). City politicians seemed to have been interested only in utilitarian approaches, and grids provided an easiest and most efficient way to lay out new developments – to paraphrase Lewis Mumford – any city clerk could do it.

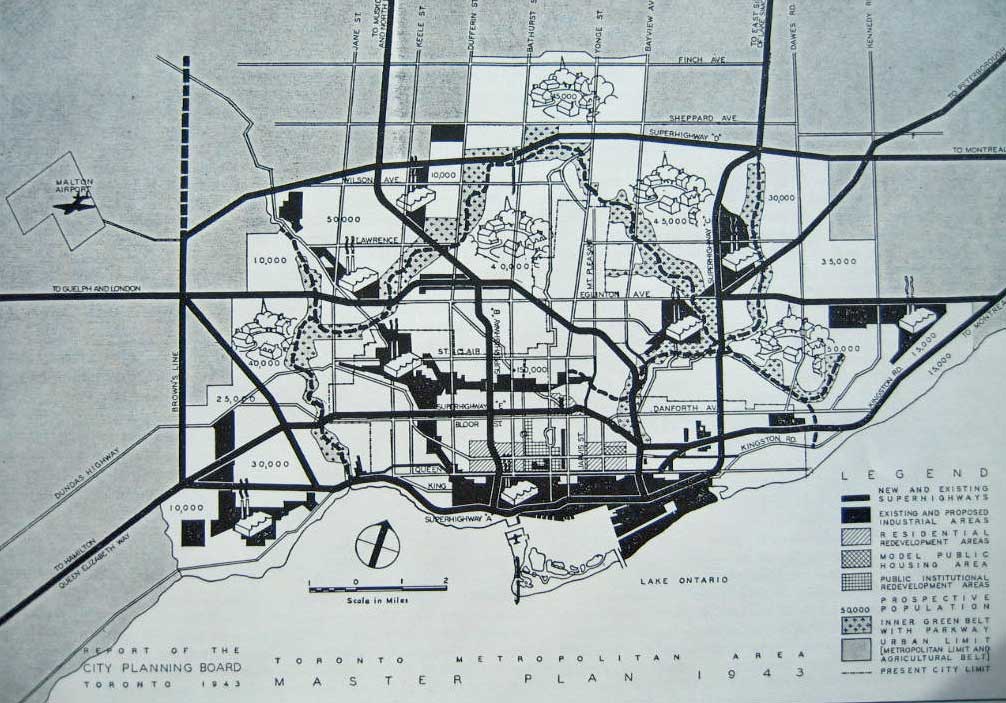
The plan that ended this long drought was this one – prepared in 1943 by an advisory board to the old City as a plan for postwar growth of Toronto.  It is significant because it is for a metropolitan area – far beyond the aegis of the old City, because it is envisaged a future based on cars not streetcars (and in fact shows a redevelopment area in the central city that would have included most of the 1880s streetcar neighbourhoods), and because it shows a number of suburban communities. The network of dark lines are “superhighways” – at the time only one, the Queen Elizabeth Way in the bottom left, had been built; there is also a network of arterials following the megagrid of the regional survey.

b-TO1943-bw_web
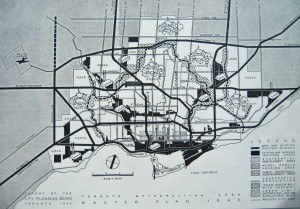
There were no tools to implement any of these proposals at the time, but those came after the war and many aspects of this plan, including several expressways, did creep into subsequent thinking and were implemented


Metropolitan Toronto

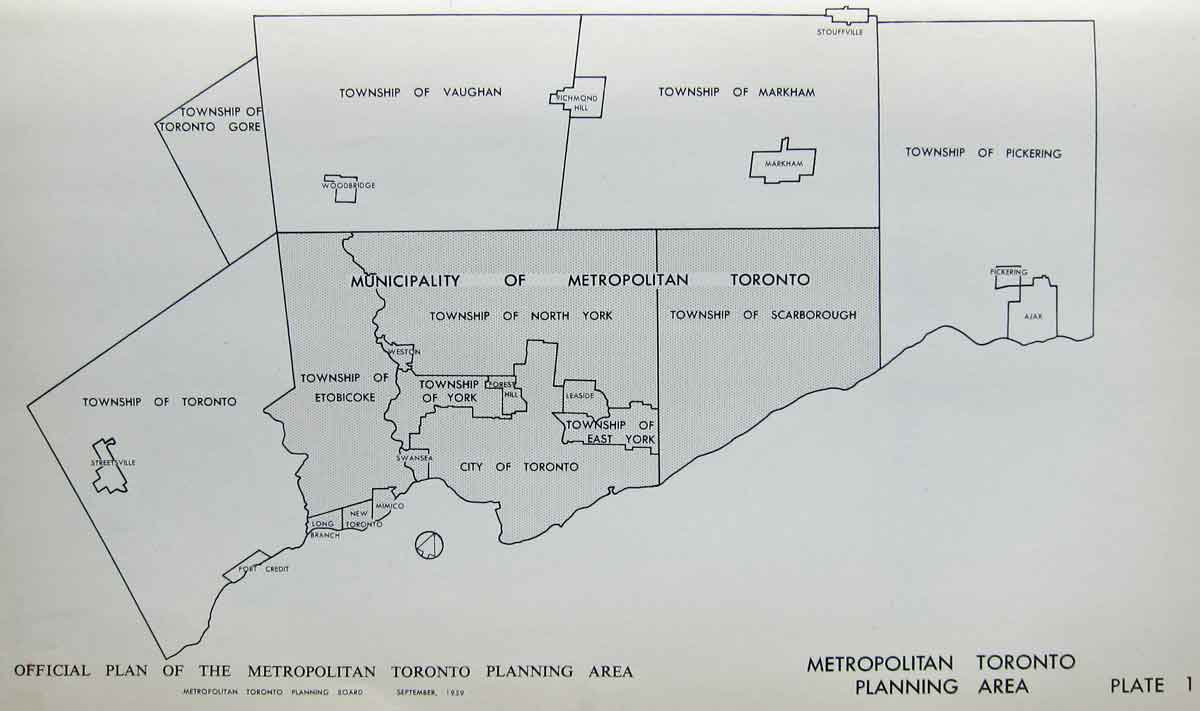
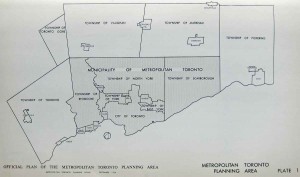
There was an international flurry of planning legislation following the Second World War.  In Ontario the first effective town planning act was passed in 1946 (under the Canadian constitution provinces have full authority over cities and municipalities). Previous acts had few teeth, but this act required municipalities to prepare official plans and provided the legal means to enforce them. Then in 1954 the province created the Municipality of Metropolitan Toronto, covering the area shown in the 1943 plan, to oversee regional growth.

d.MetroPlanningAreaweb Metro consisted a two-tiered system of government that combined the old City of Toronto with adjacent townships. Metro was the superior body and responsible for coordinating development and planning across all the local municipalities, which did retain control over local development issues.  Metro, for instance, was responsible for managing expressways and arterial roads, the lower tier municipalities were responsible for local streets and roads. Metro was also given subdivision controls for townships adjacent to its borders, a measure that ensured efficient servicing throughout the urban region and prevented leapfrog developments.

Metro was a system of urban government that was widely admired in North America and was copied in some American cities, such as Minneapolis. Here it lasted until amalgamation in 1998, though its political clout was diminished after about 1970.

Metro’s Work

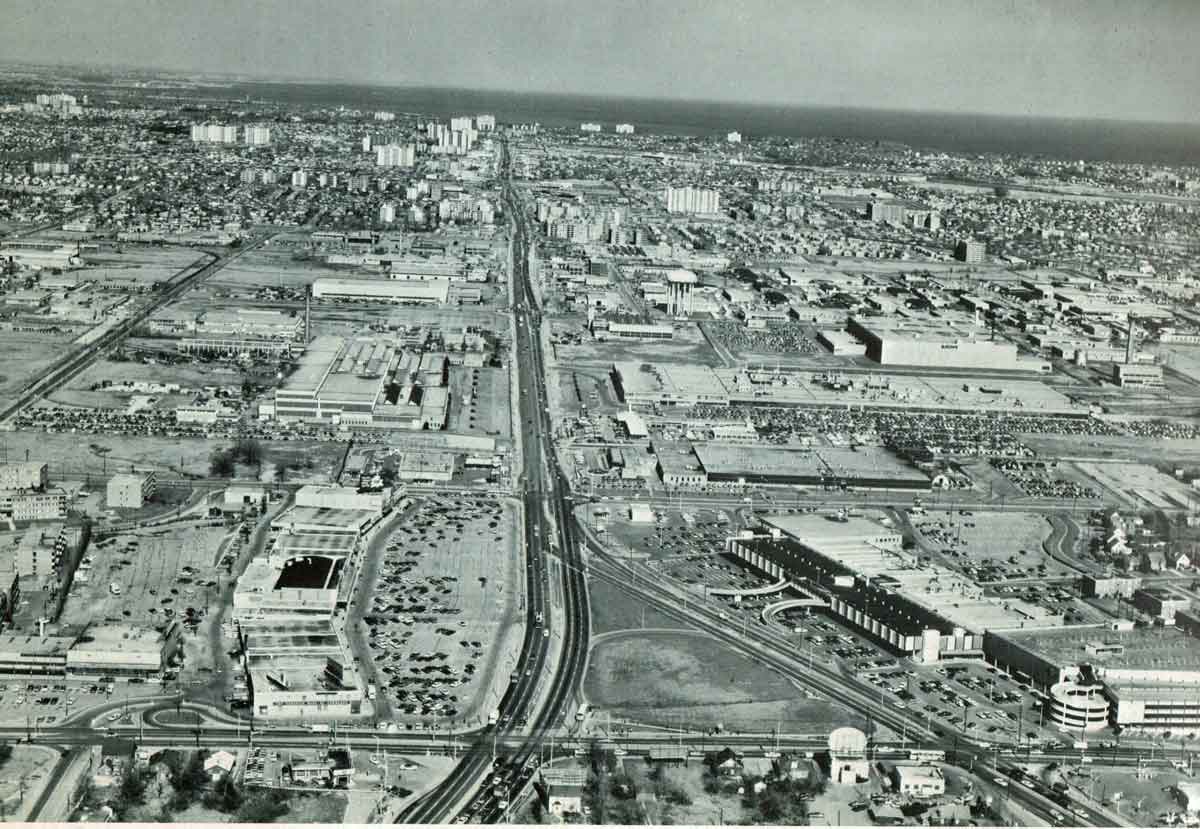
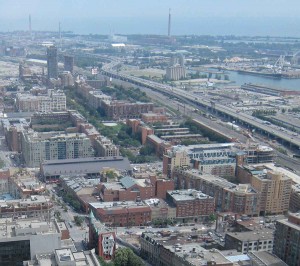
Metro was a powerful and reasonably enlightened, albeit very utilitarian institution.  Although its long-term plans called for widespread redevelopment in the central city, it never got to those, probably because it was so busy managing suburban growth.  And, unlike what happened in many U.S.cities at that time, it did nothing to undermine the streetcar system, and in fact oversaw the construction of the first subway lines here. Since the old City was full, most of Metro’s work handling growth was in the suburbs, and there a lot of what it achieved is not that exceptional – commercial strips, plazas, malls, employment districts, neighbourhood units, all the familiar elements of North American post-war, automobile oriented suburbs, can be found in Toronto’s inner suburbs. This air photo of Eglinton Avenue from 1969 shows all of these, stretching from the Don Valley to Lake Ontario.

d-GoldenMile1969airweb d-InnerApts6Kidsweb

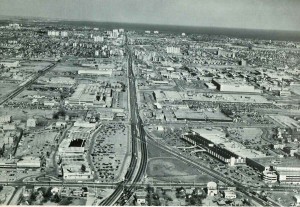
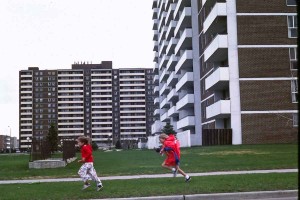
But there was one major difference.  Metro required the use of apartment towers in residential areas to increase densities in order to support bus transit, and to provide a mix of housing types.  Clusters of these can be see in the distance in the photo on the left, and they were usually grouped in clusters of 4 to 6 – not more because Metro planners did not want to create apartment ghettoes. Some of the towers were social housing, but many were private rental.  Hundreds of 14 and later 22 storey towers, mostly slabs, were built between 1955 and the early 1970s, when their construction became uneconomic. So my third comment is that while the modernist planning era of Metro Toronto ushered in a radical change in the way the city was made, the otherwise unremarkable results are exceptional in North America (with the possible exception of Montreal) because of its landscape of apartment clusters in the inner suburbs. These are a major reason why skyscraperpage.com ranks Toronto second in the world after New York City for the number of skyscrapers over 12 storeys.

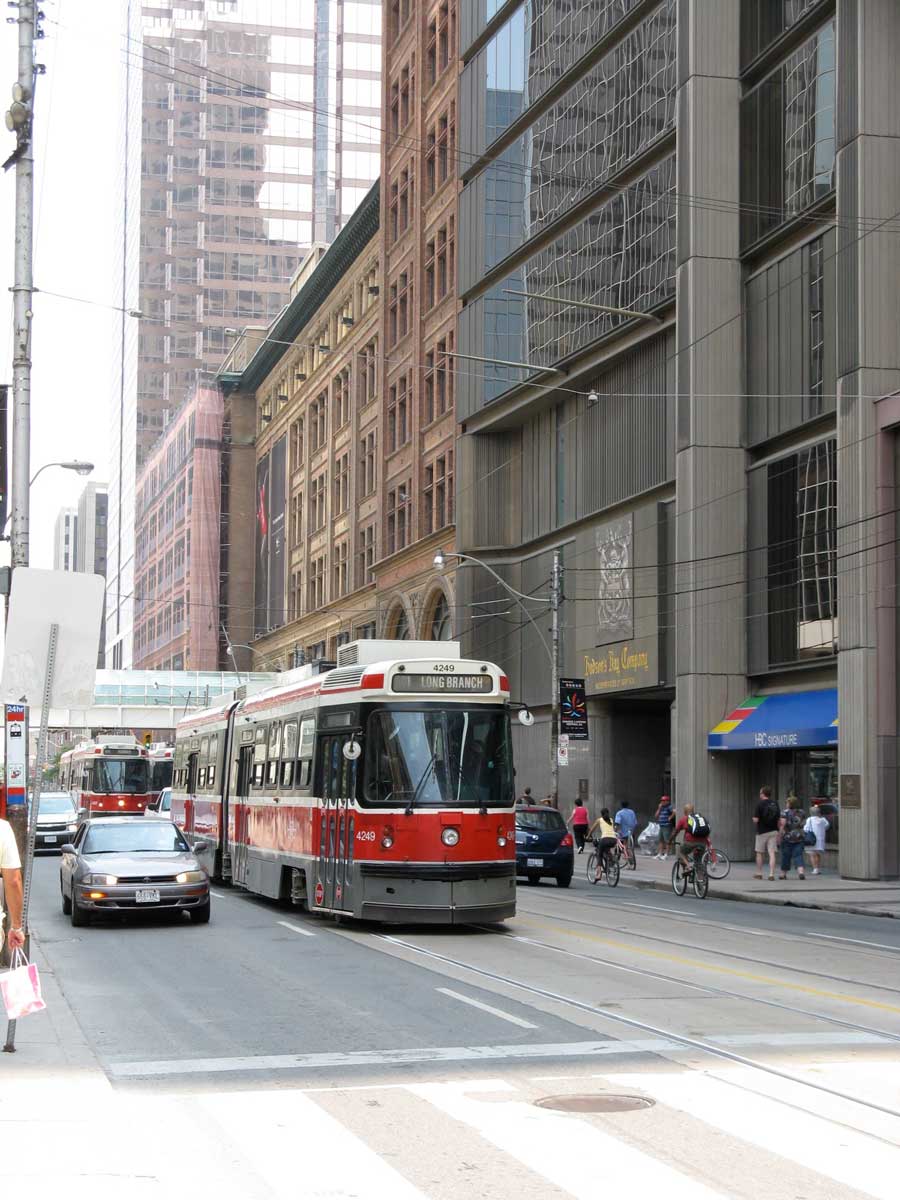
Revitalization of the old Streetcar City

Metro ruled the roost until about 1970, managing suburban growth, building expressways (the Don Valley Parkway and the Gardiner), upgrading services, financing subway construction.  Its ideological superiority ended about 1970 when the Spadina expressway, already under construction in the north-west suburbs, ran into a major political protests by residents of the old City, where it would have destroyed streetcar neighbourhoods near the University.  The expressway was stopped by the province.  This in itself is not unusual in North America, a number of cities have expressway stubs, but in Toronto it shifted the planning and political balance to the old City which became quickly and increasingly aware of the value of the forms of the streetcar city, something that had not hitherto been regarded as obvious. My fourth set of comments has to do with the way that the old city has been revitalized and changed its identity since then.

TOBloorStWest1968web  4bTOBloorWsidewalksale92-web

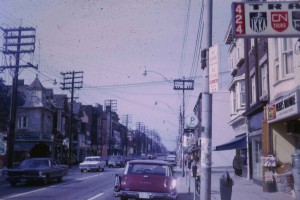
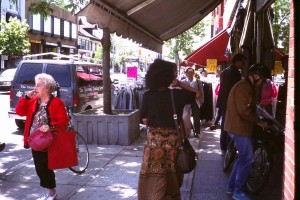
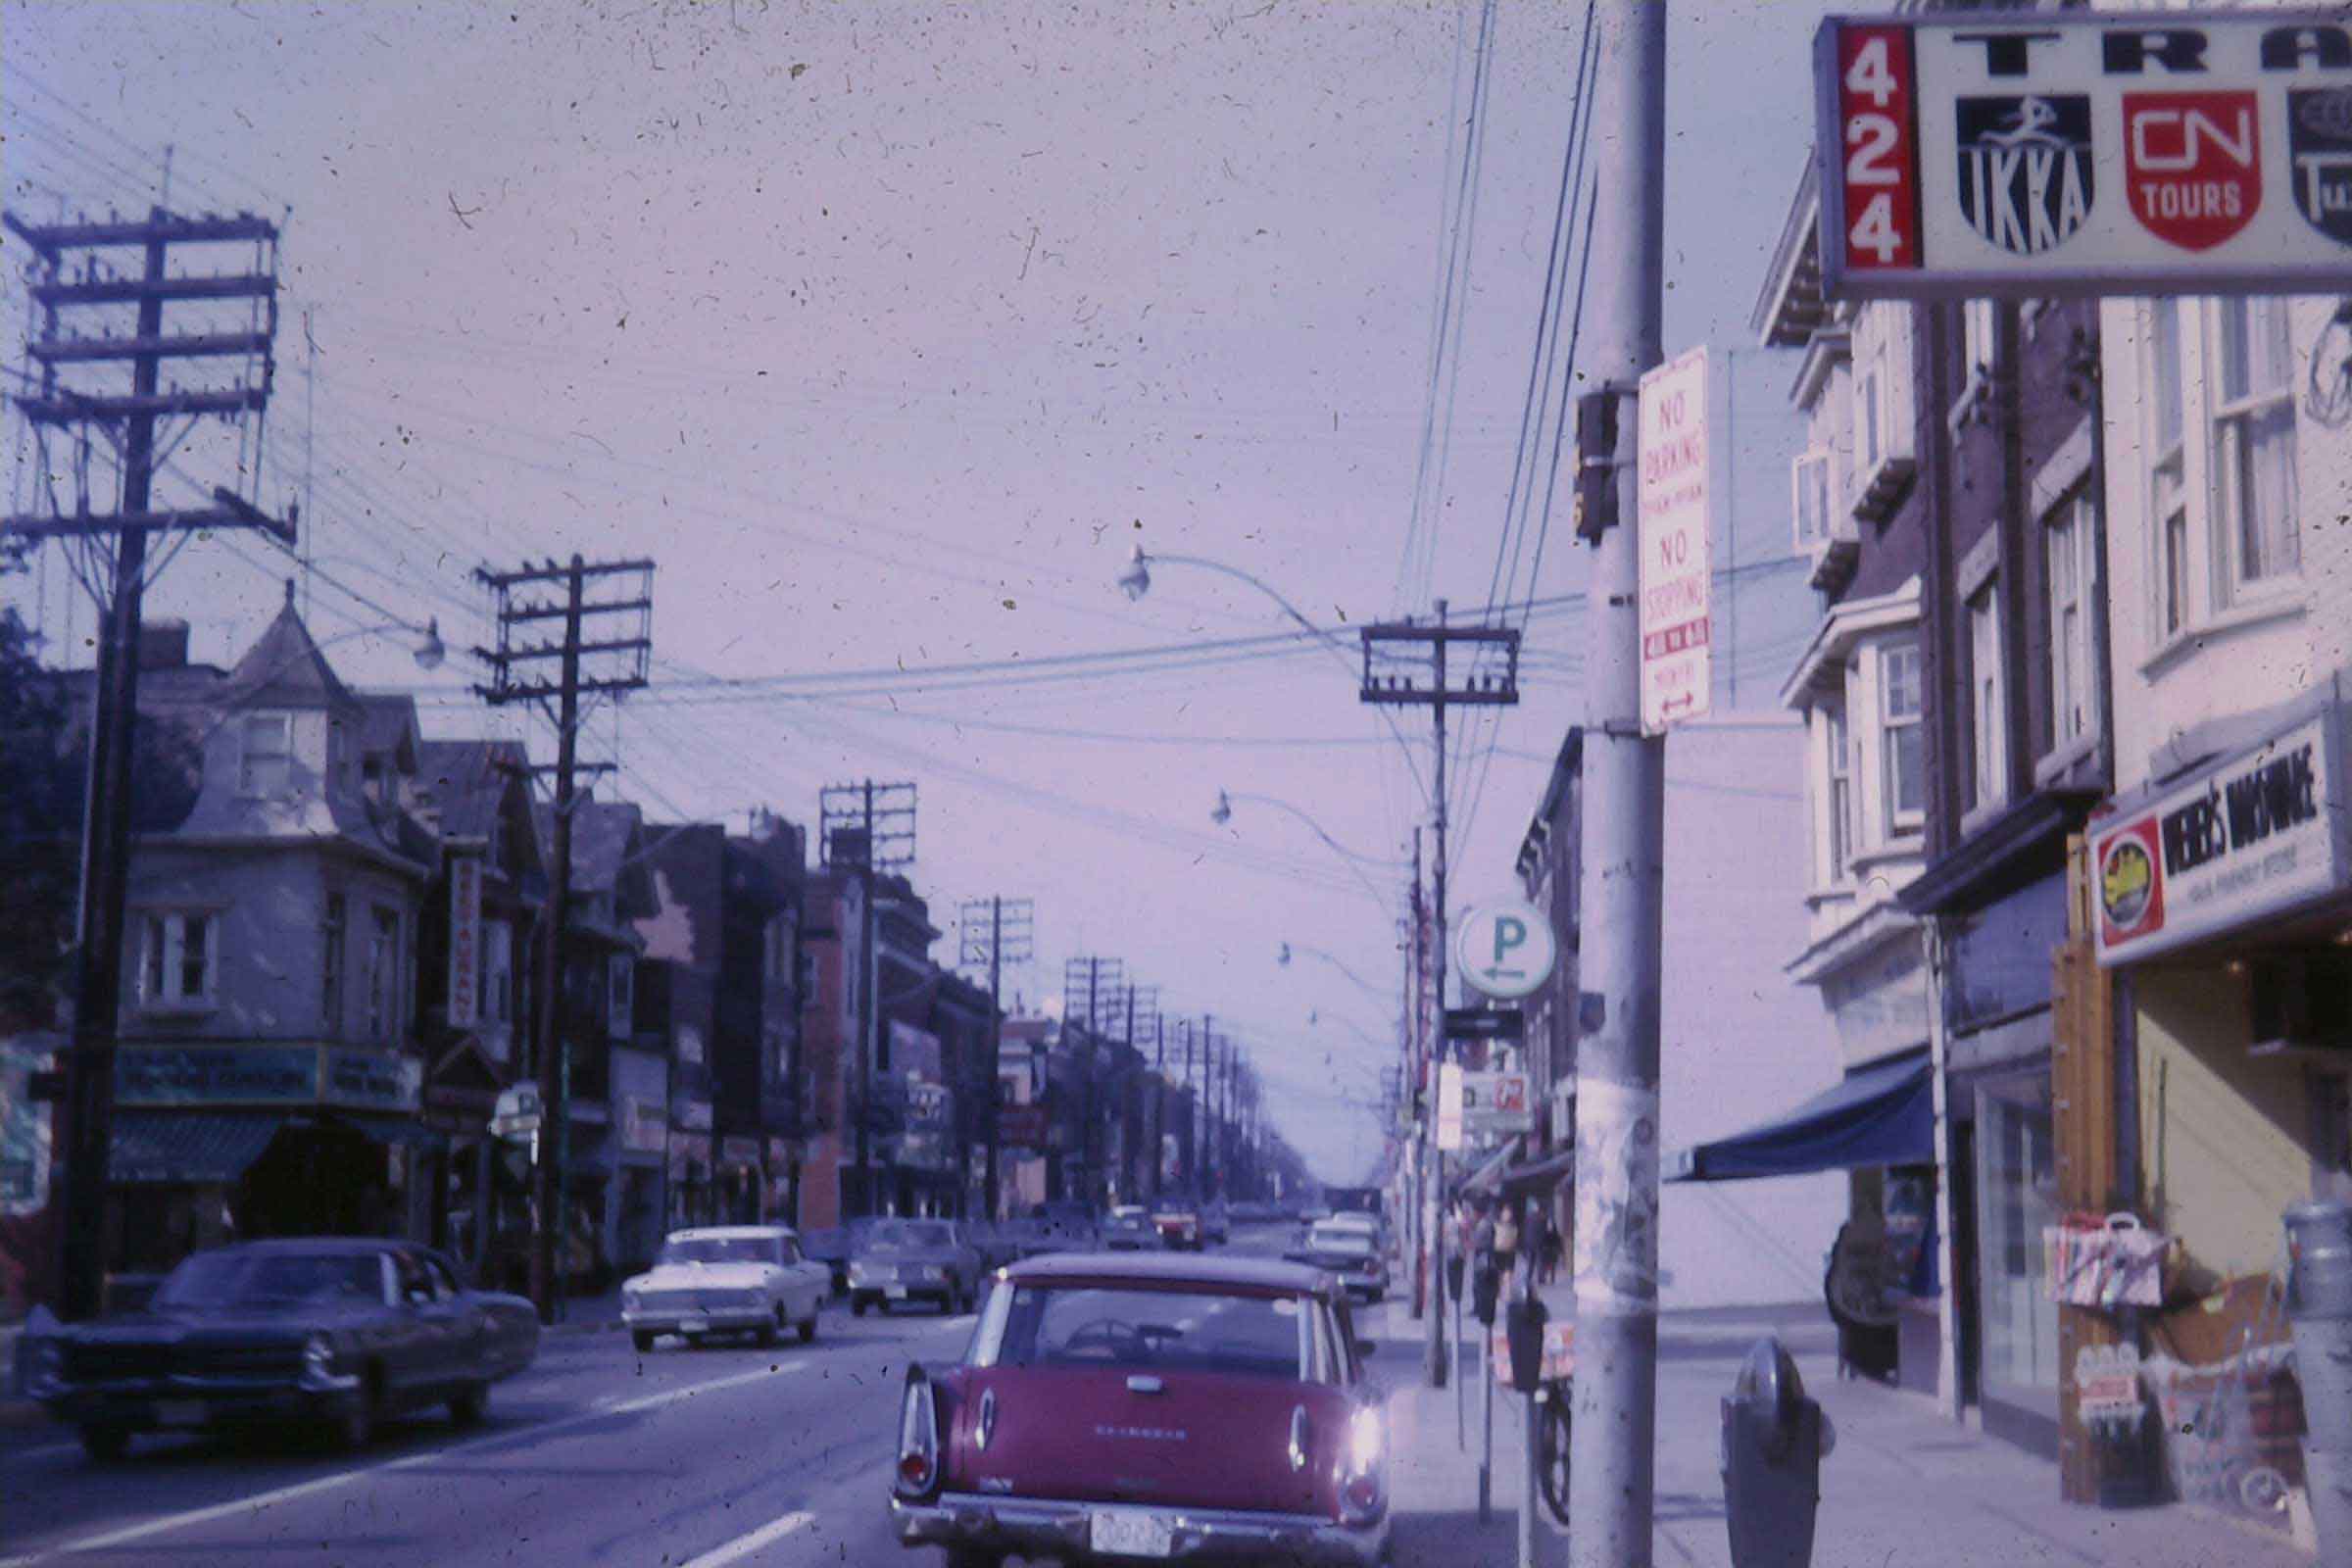
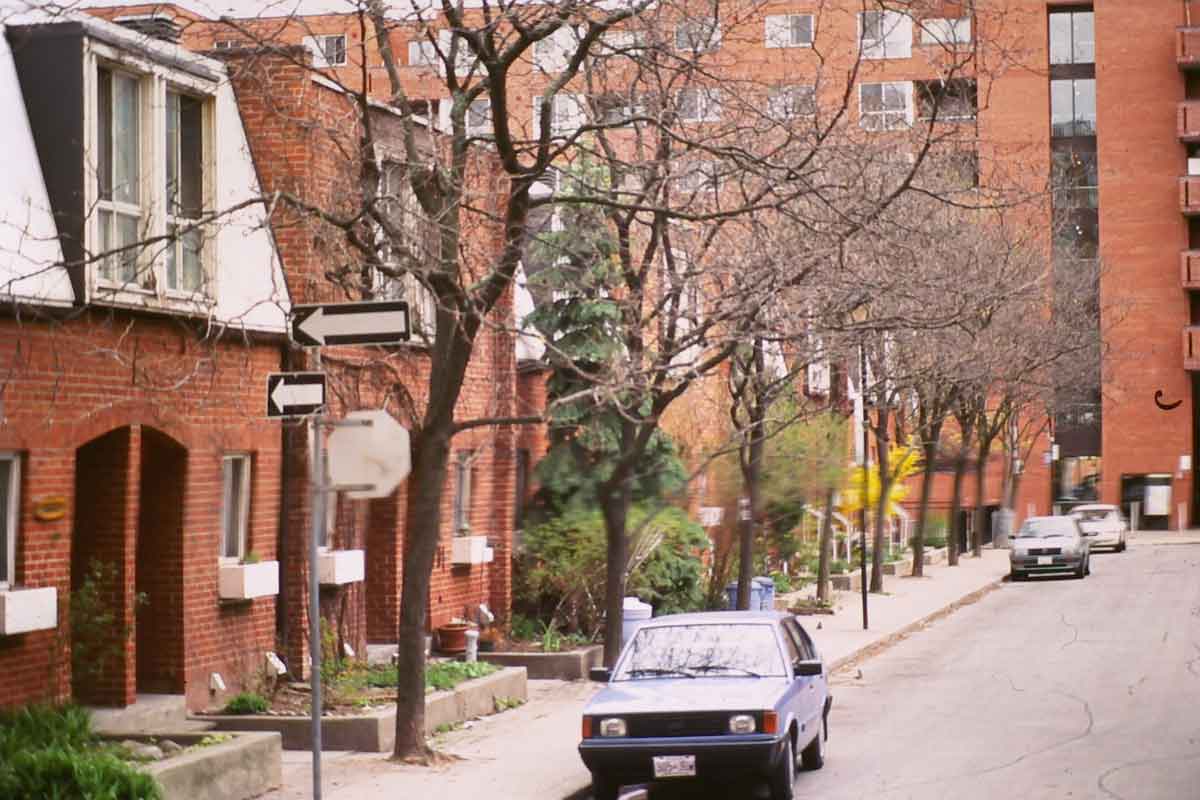
These photos are both of Bloor West near Brunswick Avenue (and where Jane Jacobs lived) – the one on the left from 1969 or 1970, the one on the right from 1992. In 1970 the Bloor subway had already replaced streetcars here but this gives a sense of drabness, buildings still covered with industrial grime, poles and wires, sidewalks were strictly for walking, as was true of all the main streets. By 1992 the wires had gone, there were trees in planters, sidewalk sales and cafes – the streetcar city was being celebrated in daily life.

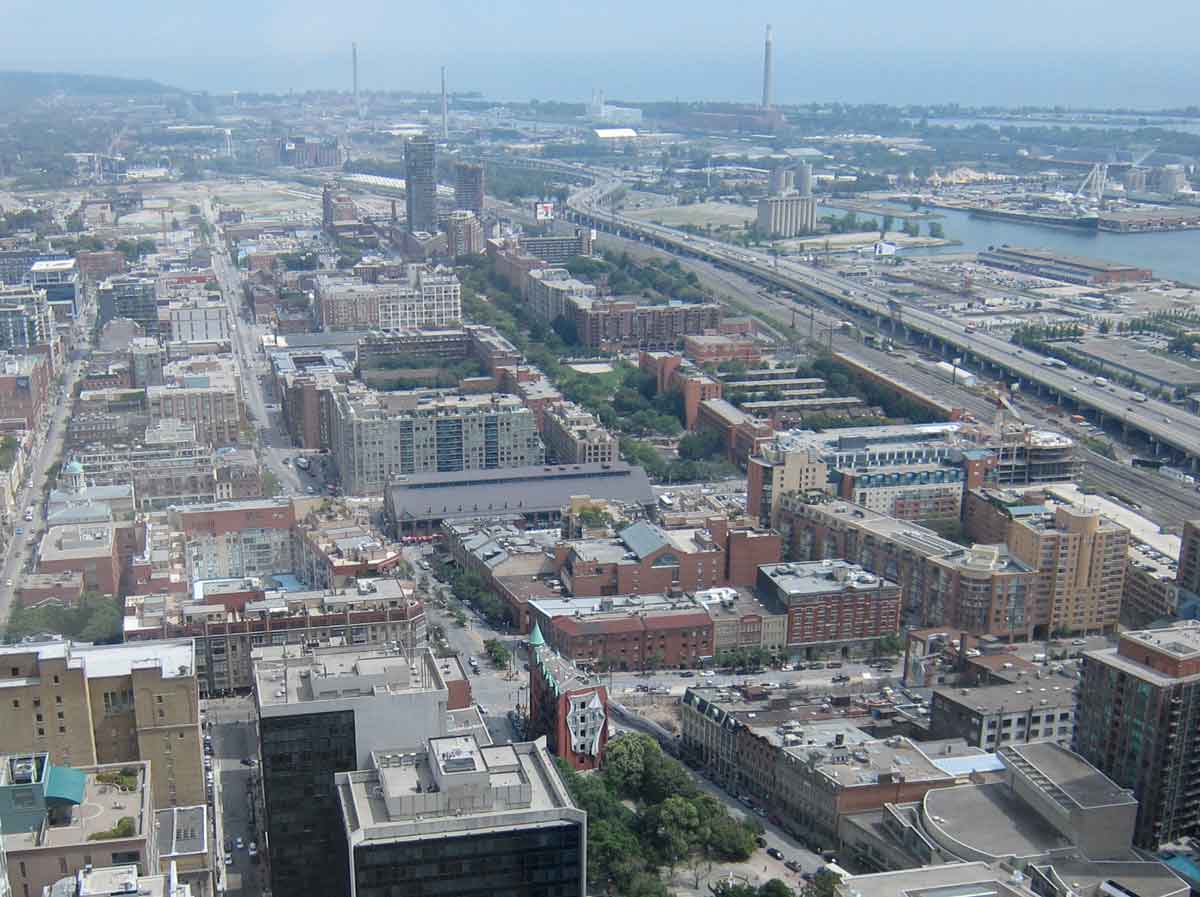
A key to this revitalization was a concerted effort by old City planners and politicians to maintain the population of the central area at a time when US rustbelt cities were experiencing rapid hollowing-out as a result of deindustrialization. St Lawrence Neighbourhood, just east of downtown, was the flagship project for this in the 1980s.  It is a mixed income, mixed ownership (from fully subsidized to fully owned), mid- and low-rise, social housing project for about 10,000 people.  It was built on former industrial sites next to the railway. Unlike the superblock urban renewal projects of the 50s and 60s, this was street-oriented (in fact it extends some of the streets in the first 1793 plan). There are schools and parks, and families want to live here.  Similar but smaller projects were built elsewhere in the old city, and they are a major reason why Toronto’s central area population did not decline.

bStLawrencefromSCotiaTowerweb bTOStLawrenceweb

The photo on the left shows the rectangular blocks of St, Lawrence in the middle-right, next to the railway.  The townhouses are in the centre of those blocks.  The basic form has been copied in several adjacent developments. 

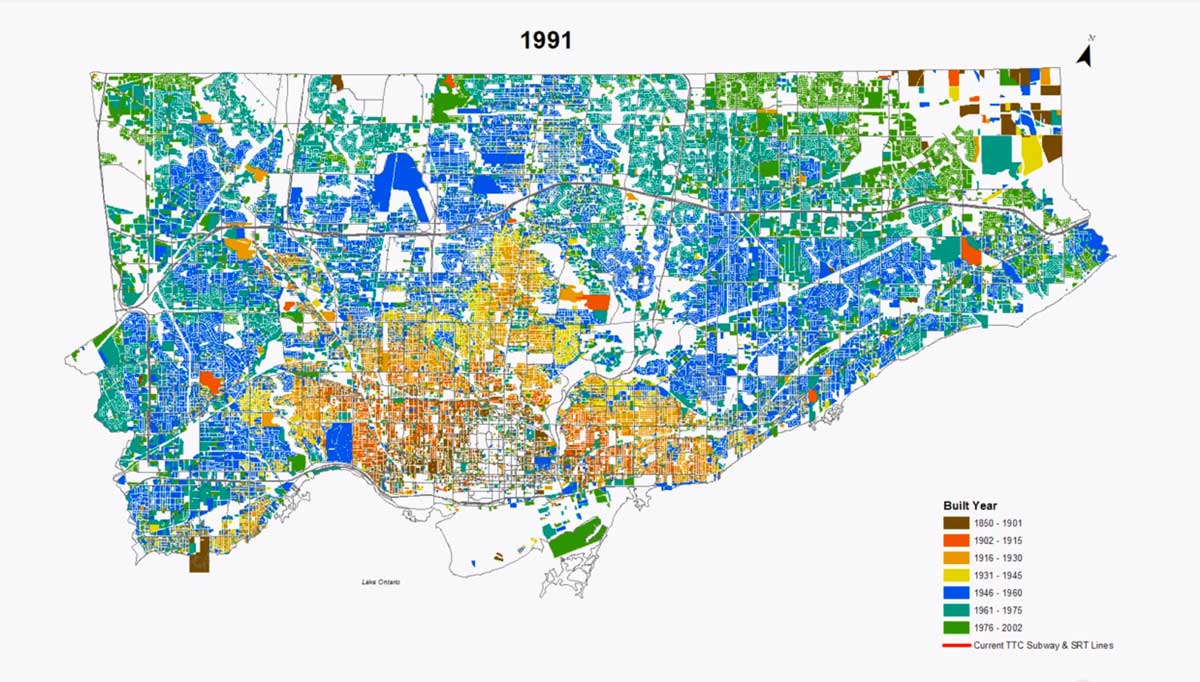
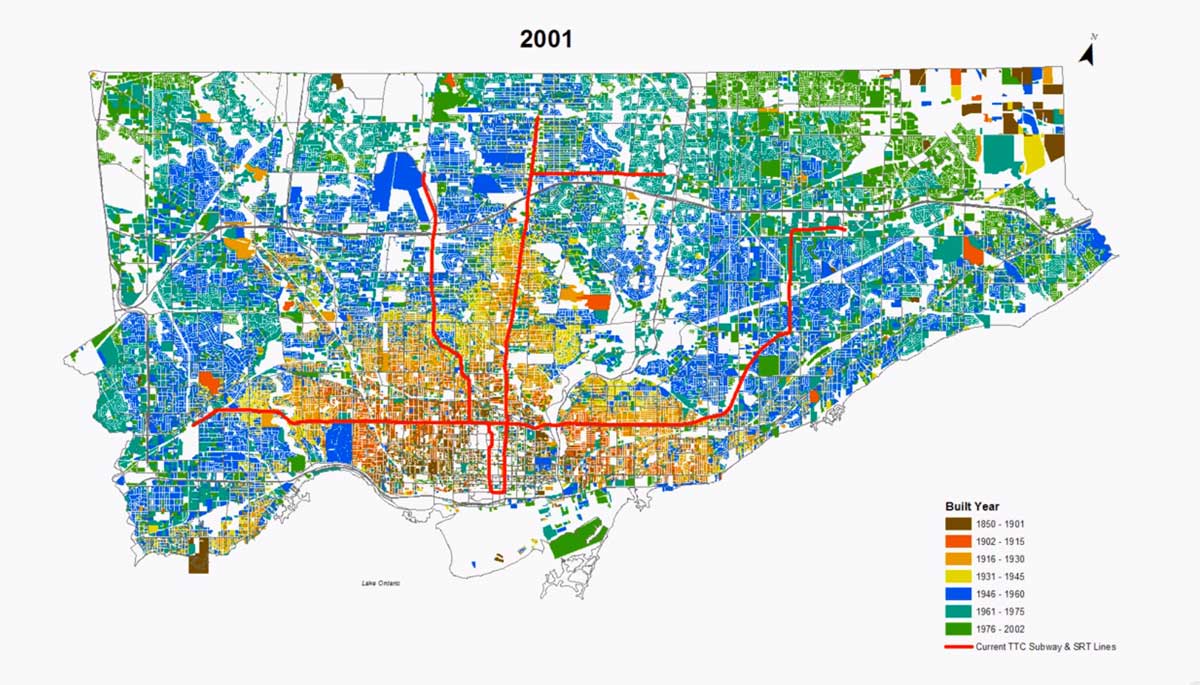
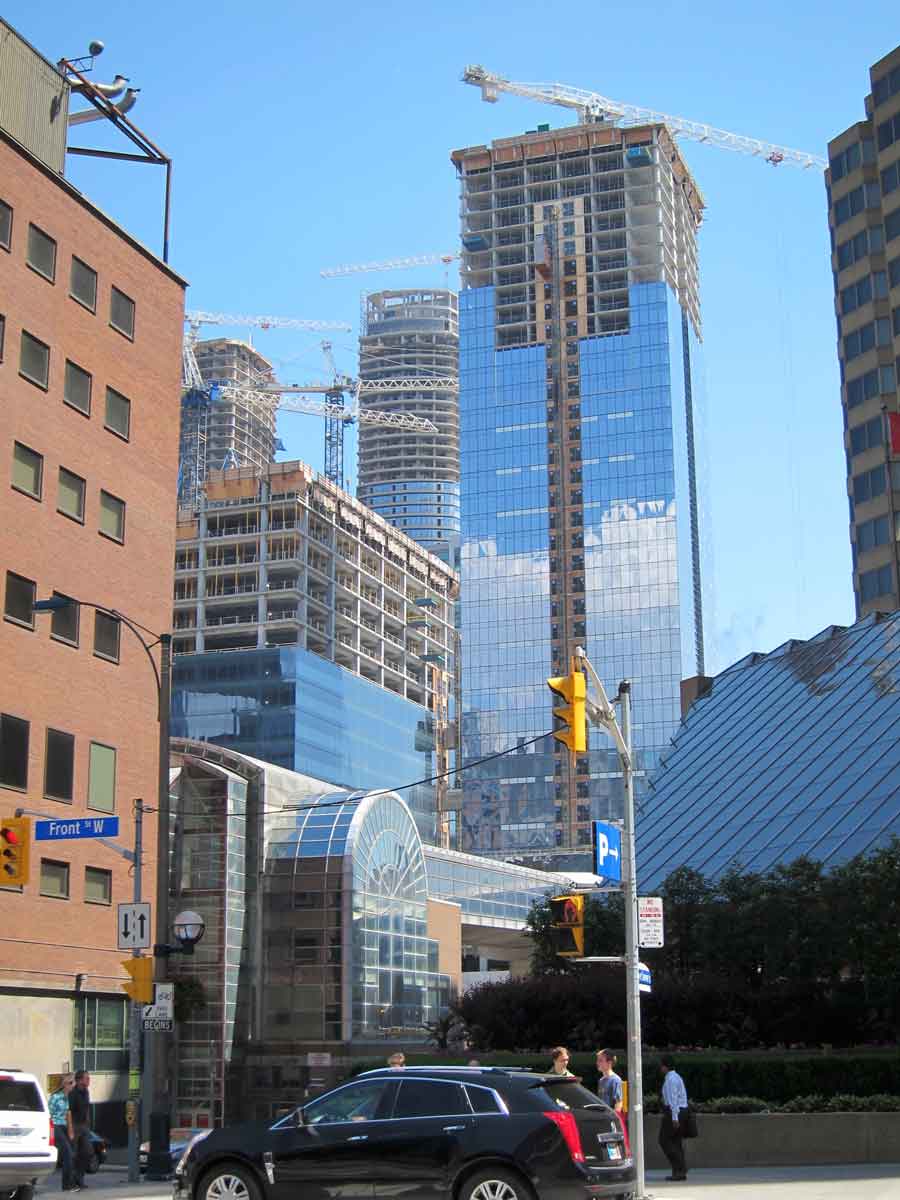
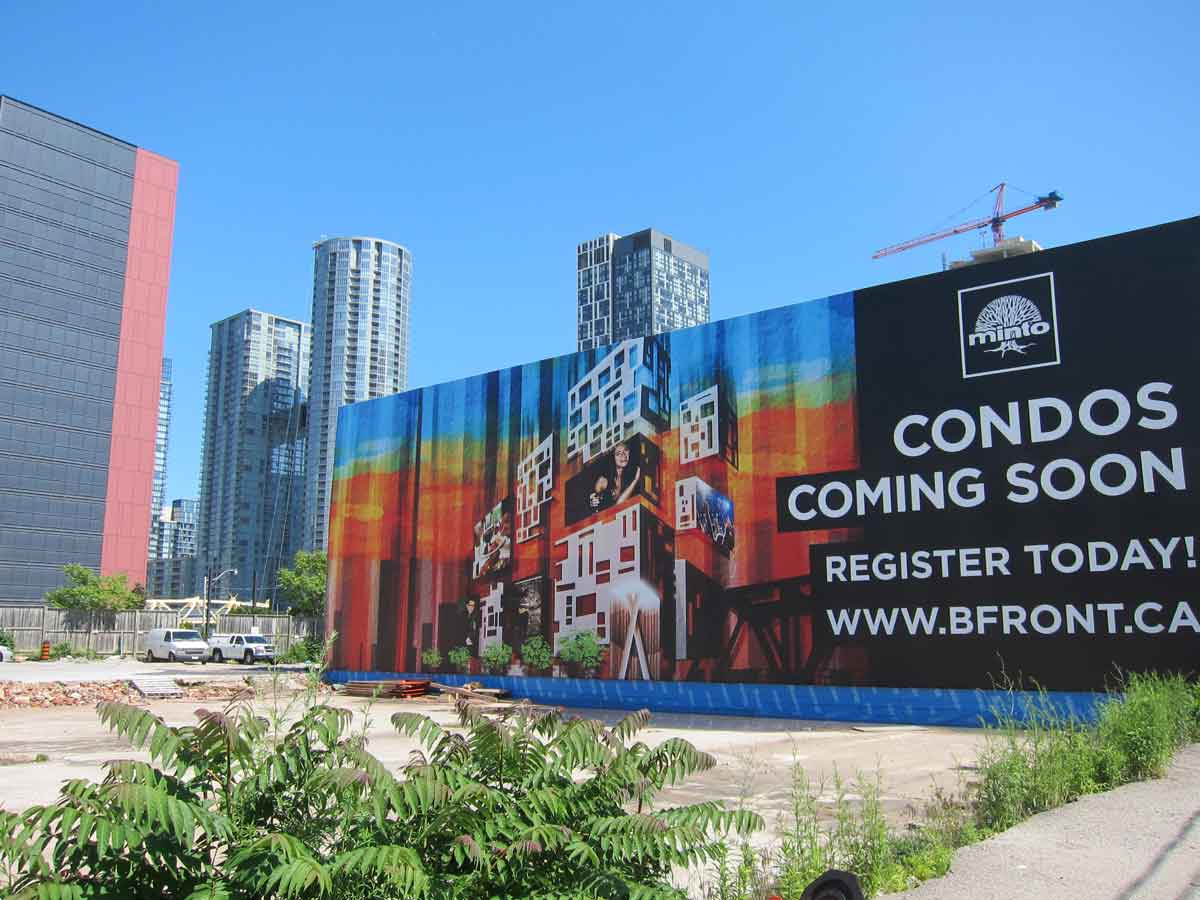
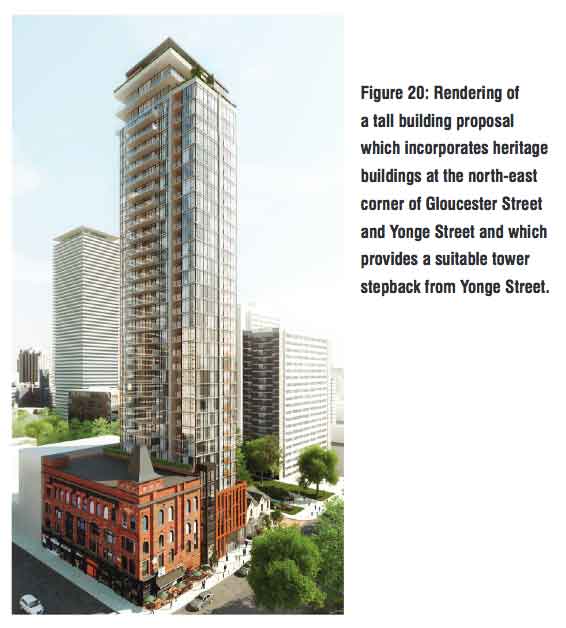
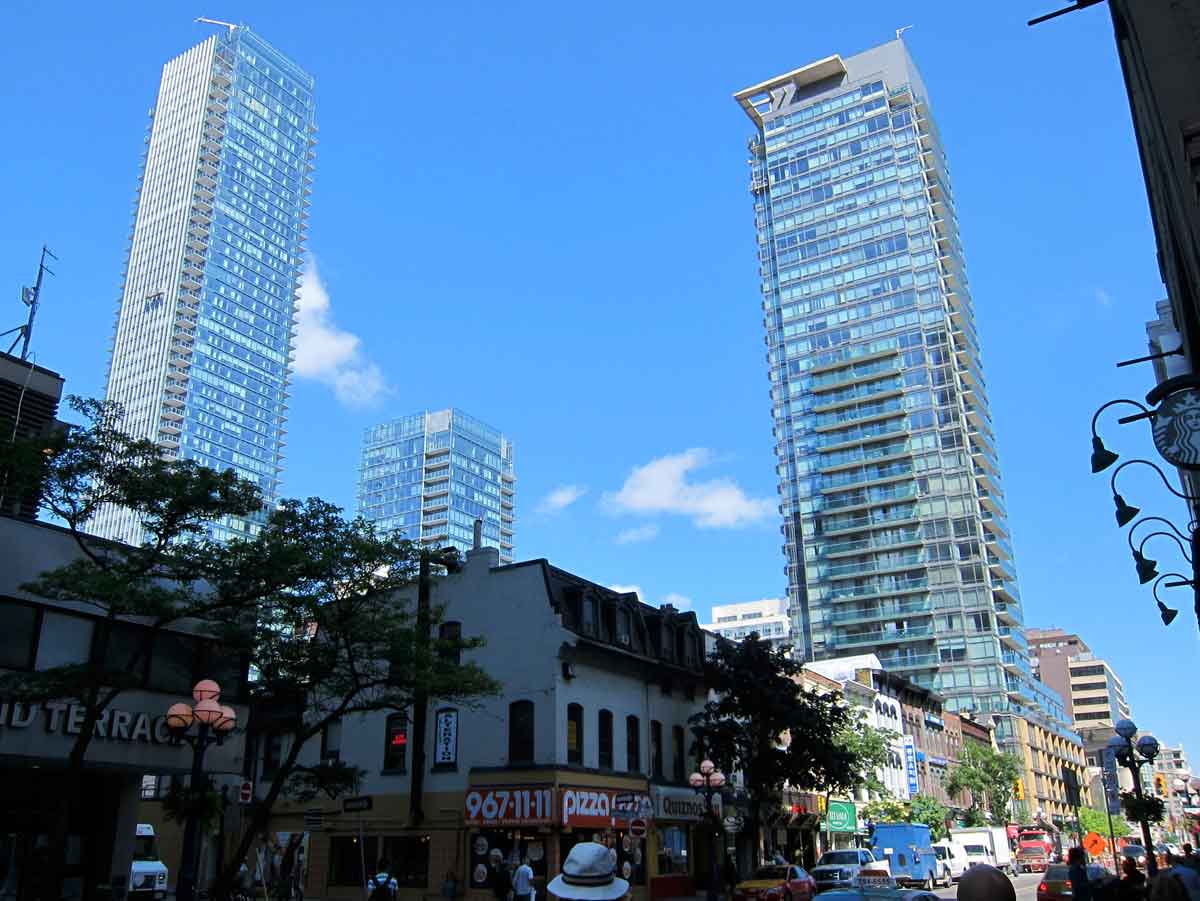
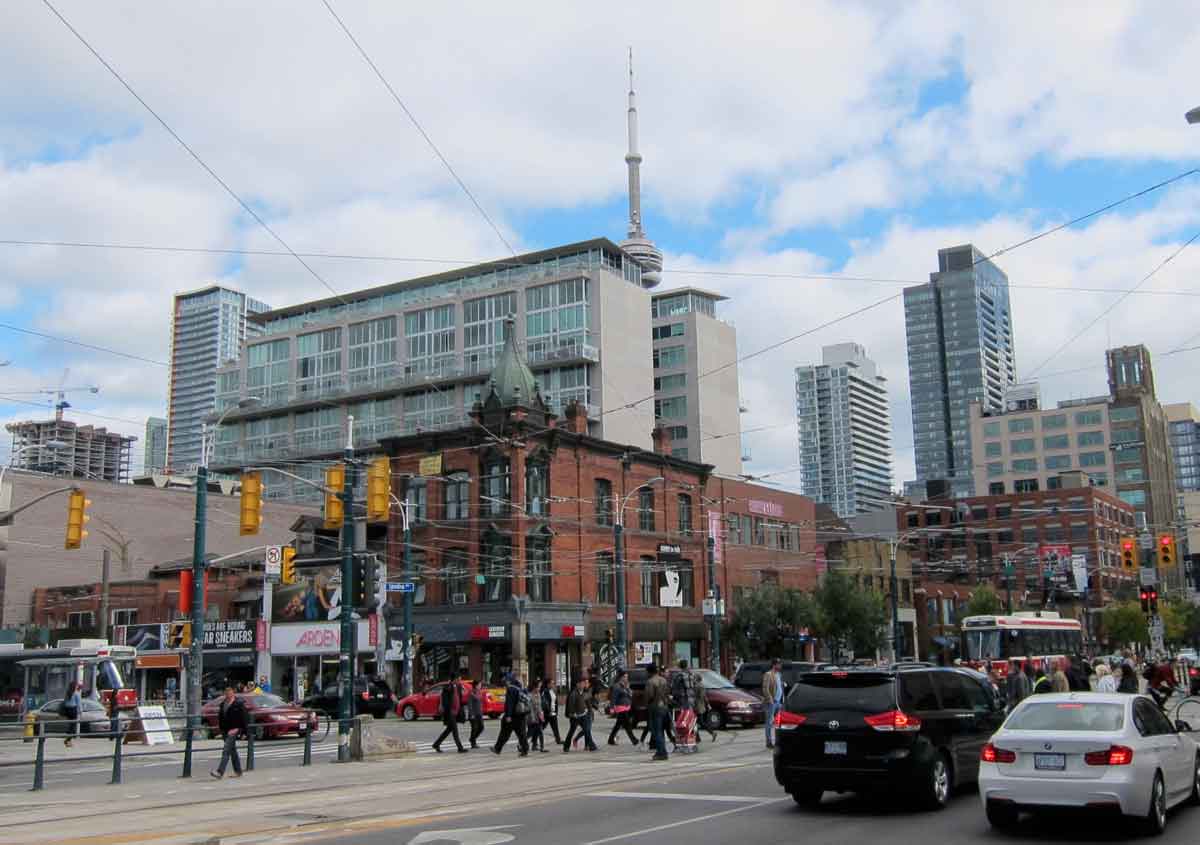
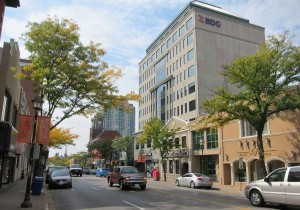
In the early 1990s provincial and federal governments withdrew subsidies for social housing, so planners in the old City rethought their strategy by removing restrictive zoning in two obsolete commercial/industrial areas on either side of downtown (known as the two kings because they were centred on intersections with King Street).  Private developers seized the opportunity to build condominiums, beginning a boom in condominium construction that continues to the present. At first the buildings were quite modest and limited to those two areas, but they now reach skywards and have spread throughout most of the new City of Toronto and into the outer suburbs. This boom has contributed to an increase in the central area population, which since the late 1970s has grown by well over 70,000, and this has in turn contributed to revitalization of the streets and institutions in the core of the old city.

cTOSkylineSkyscrapers2012web

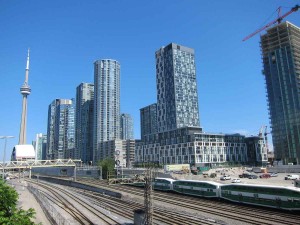
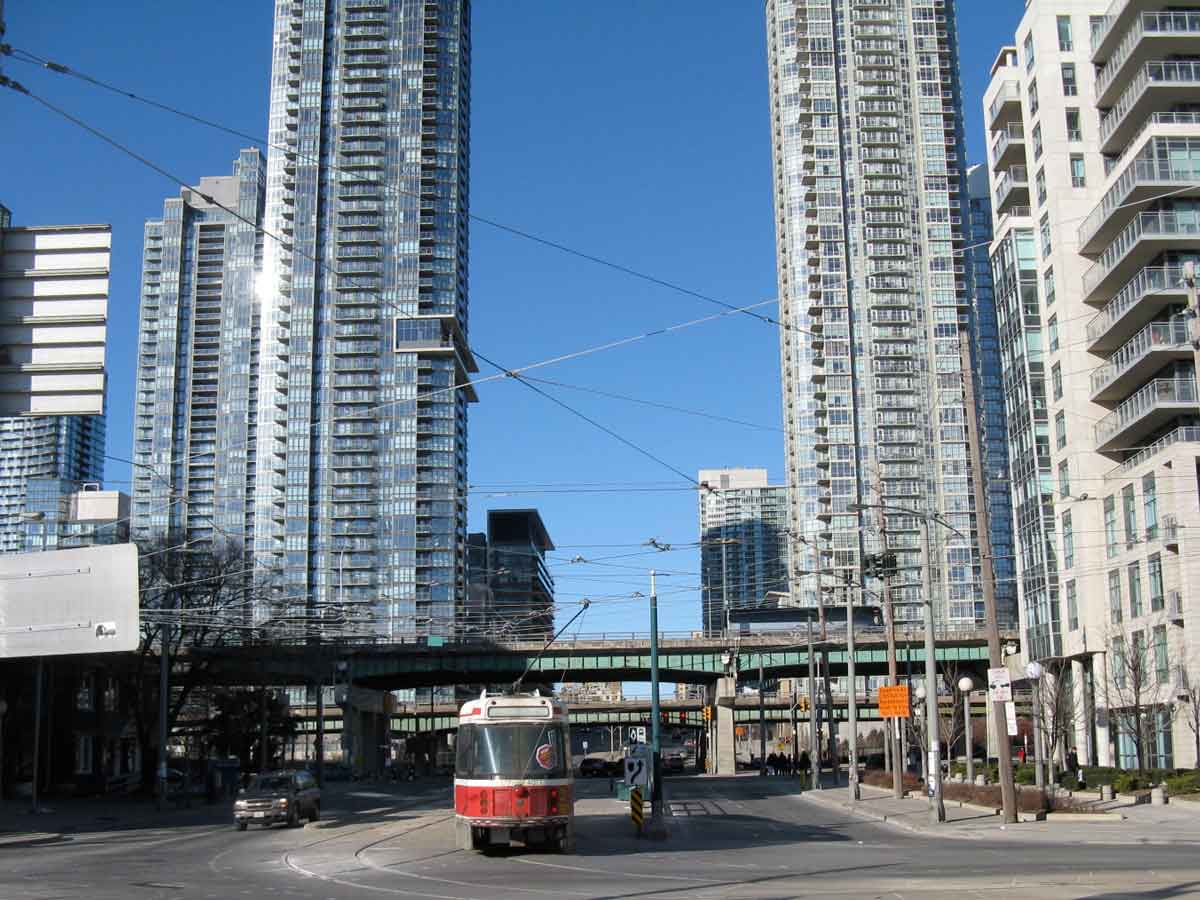
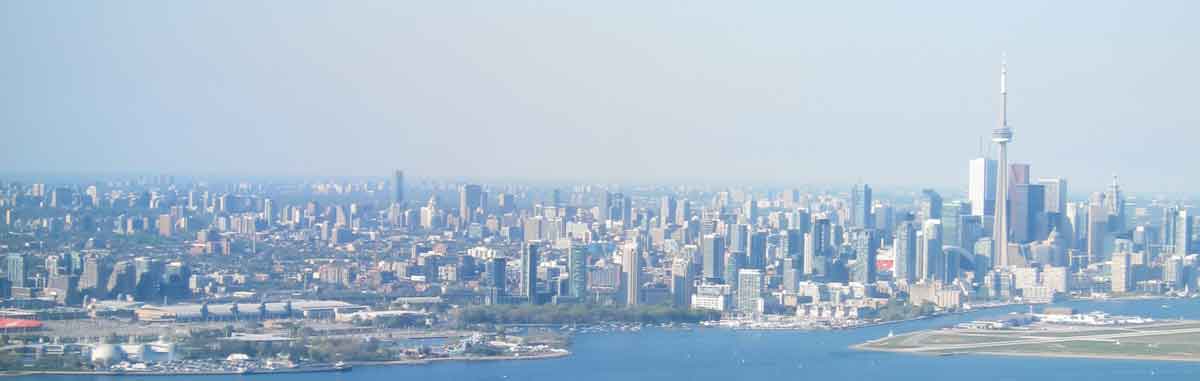
Except for the cluster of office skyscrapers behind the CN Tower almost every tall building in this 2012 photo is a condominium, along the lakeshore and off into the distance.

Diversity of the Outer Suburbs

My fifth set of comments are to do with the growth and diversity of the outer suburbs.

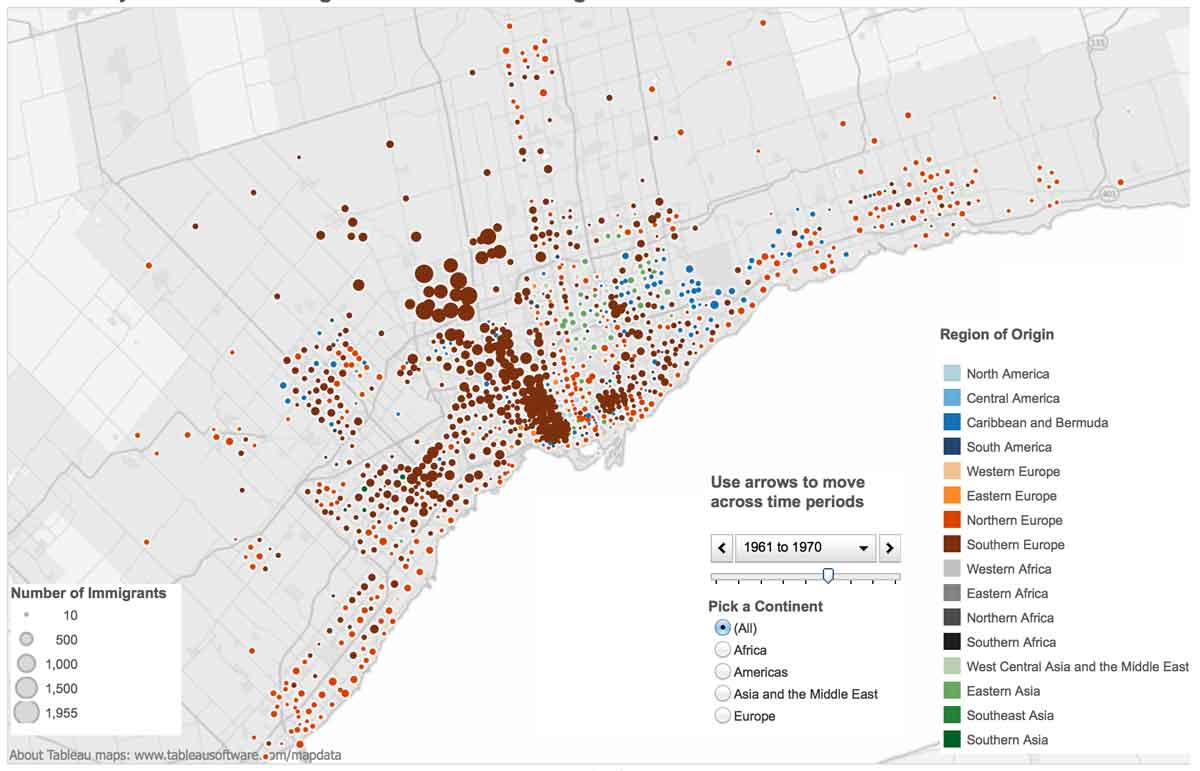
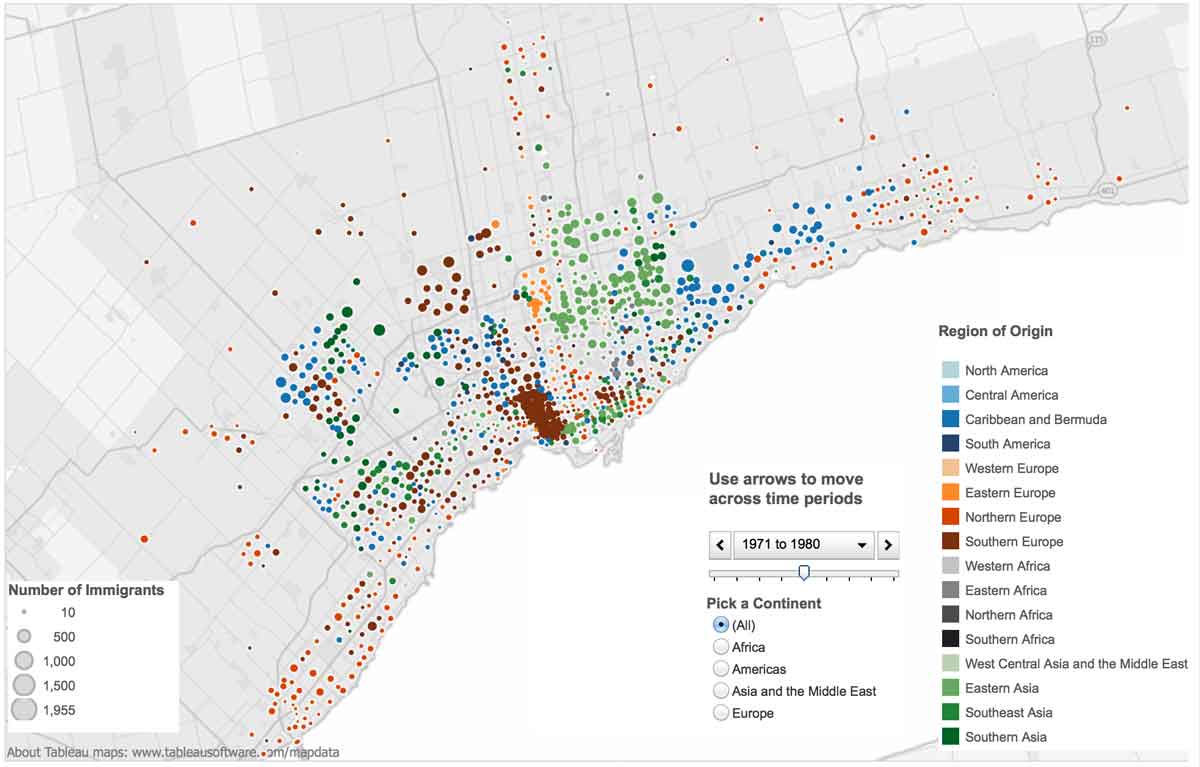
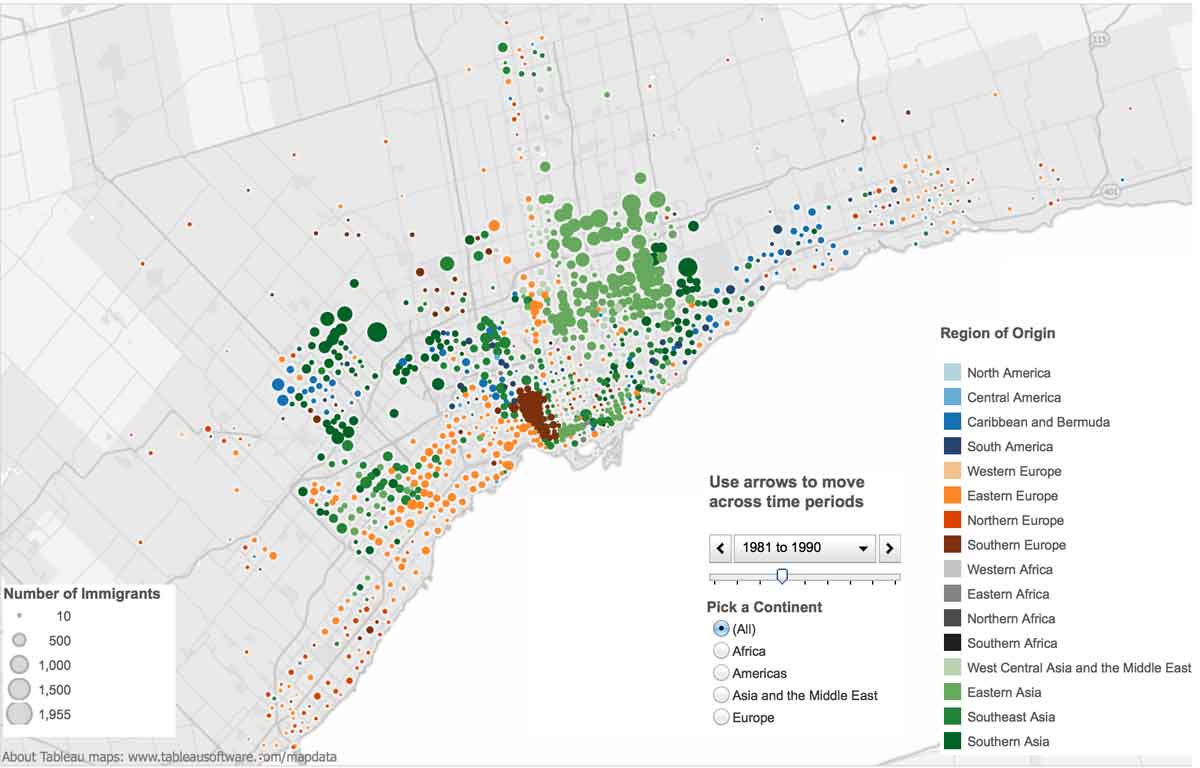
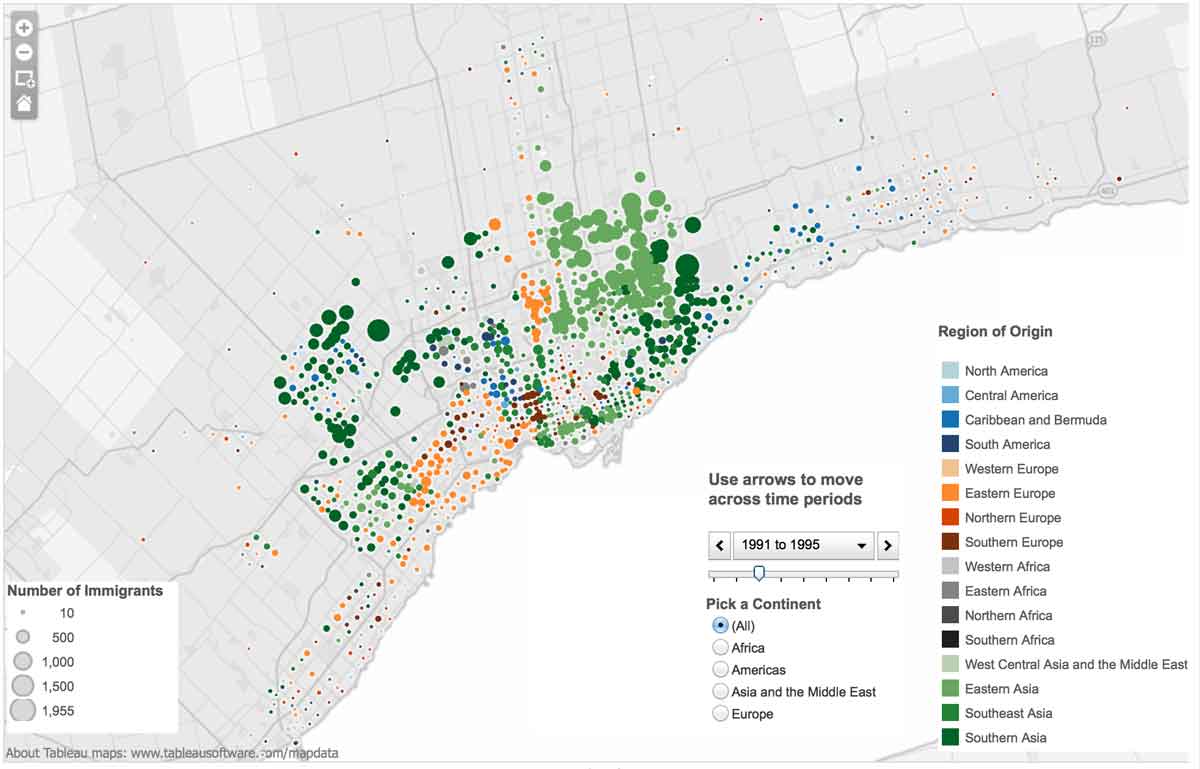
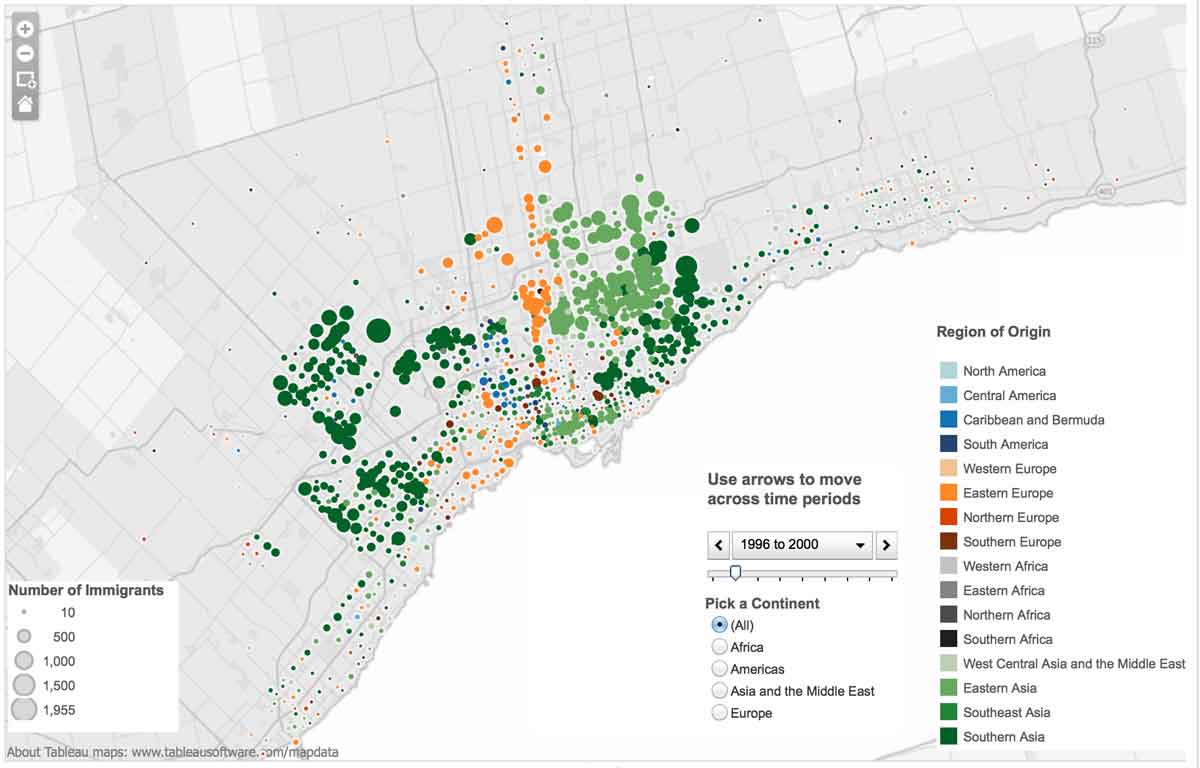
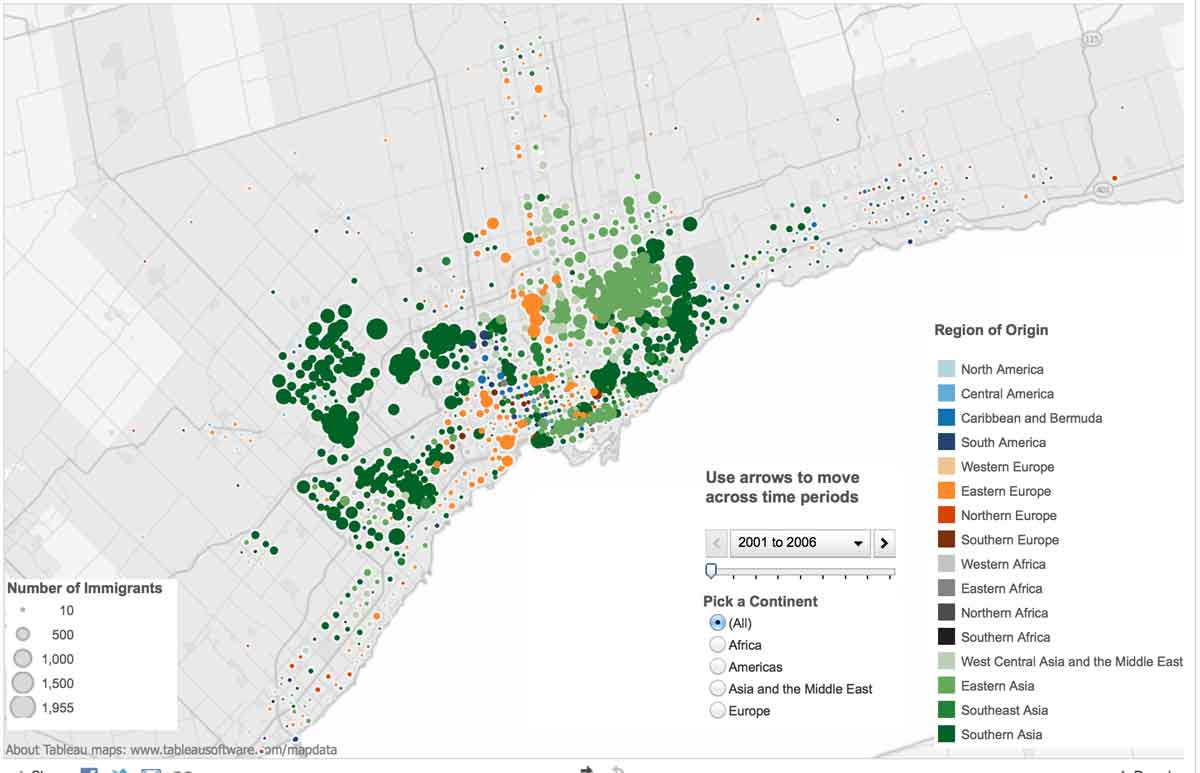
About 1970 the federal government removed previously restrictive immigration policies, in effect opening Canada to the world, and at the same time increasing the annual number of immigrants to about 200,000.  Ever since and each year about half those immigrants have come to the Toronto region (about 3 million), and since Metro was almost built-up by 1975 this has driven the growth of the outer suburbs.

ethnicenclaves_politicsforumweb
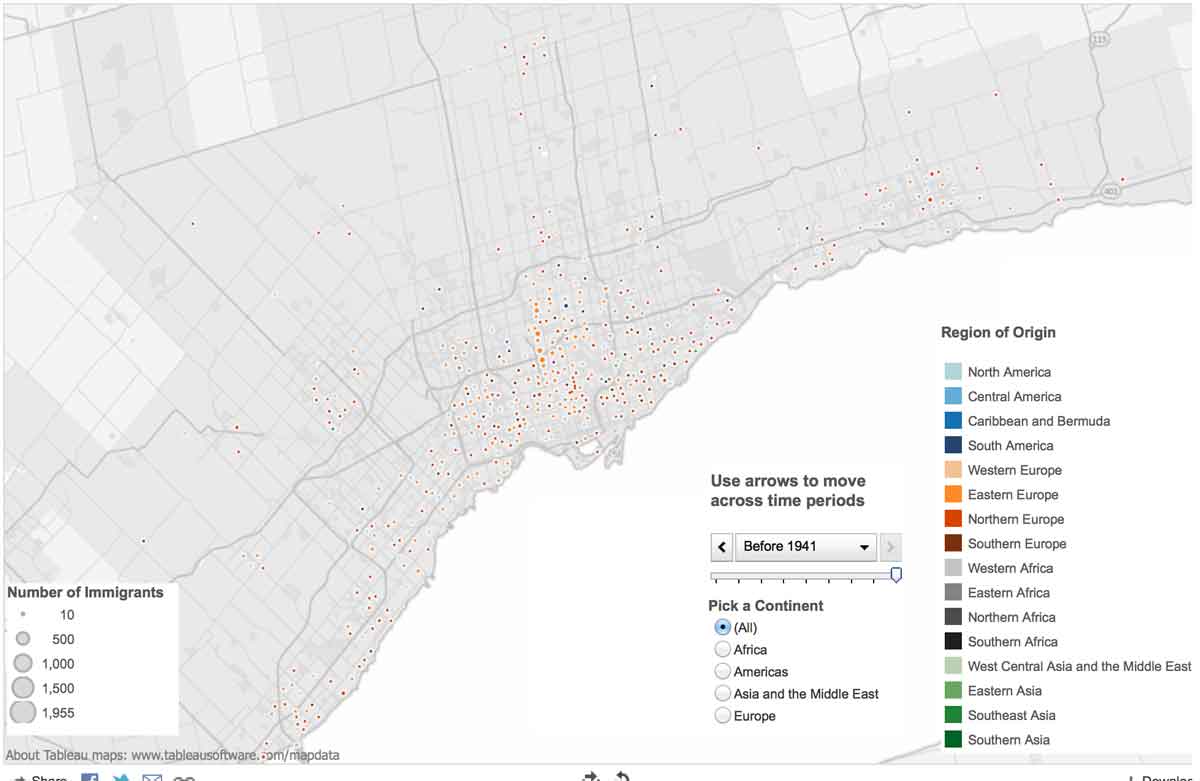
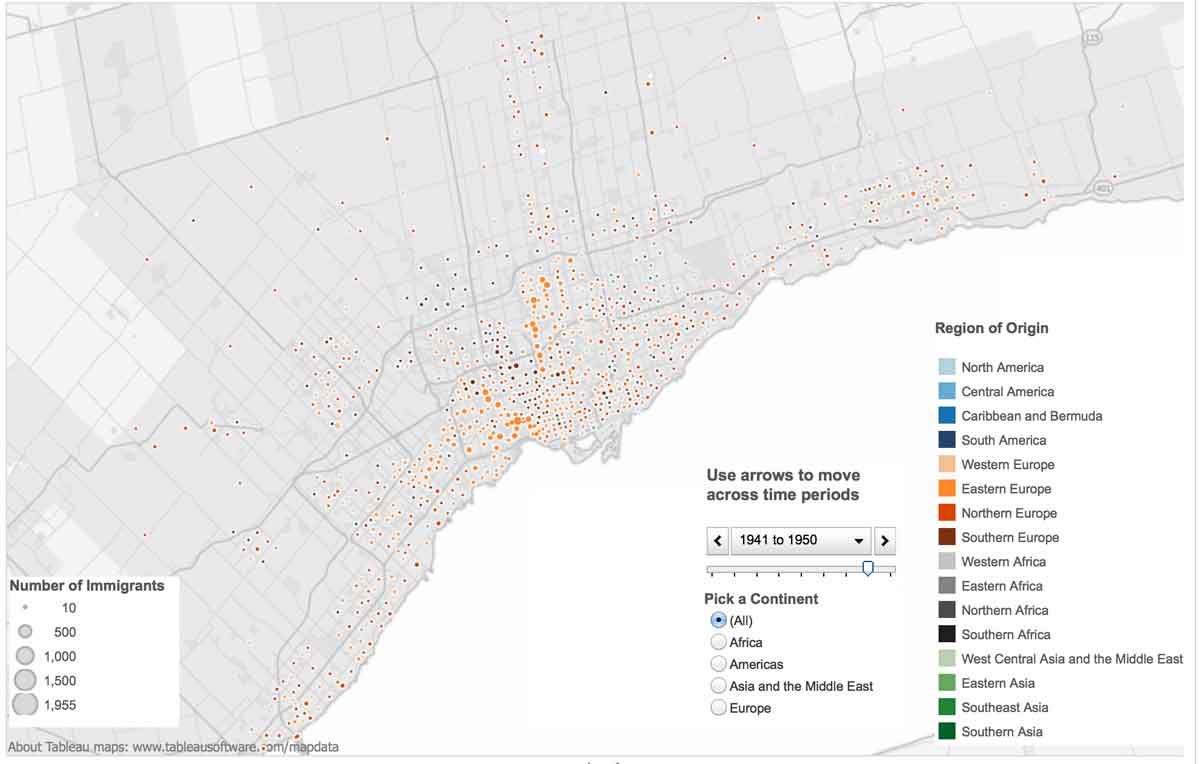
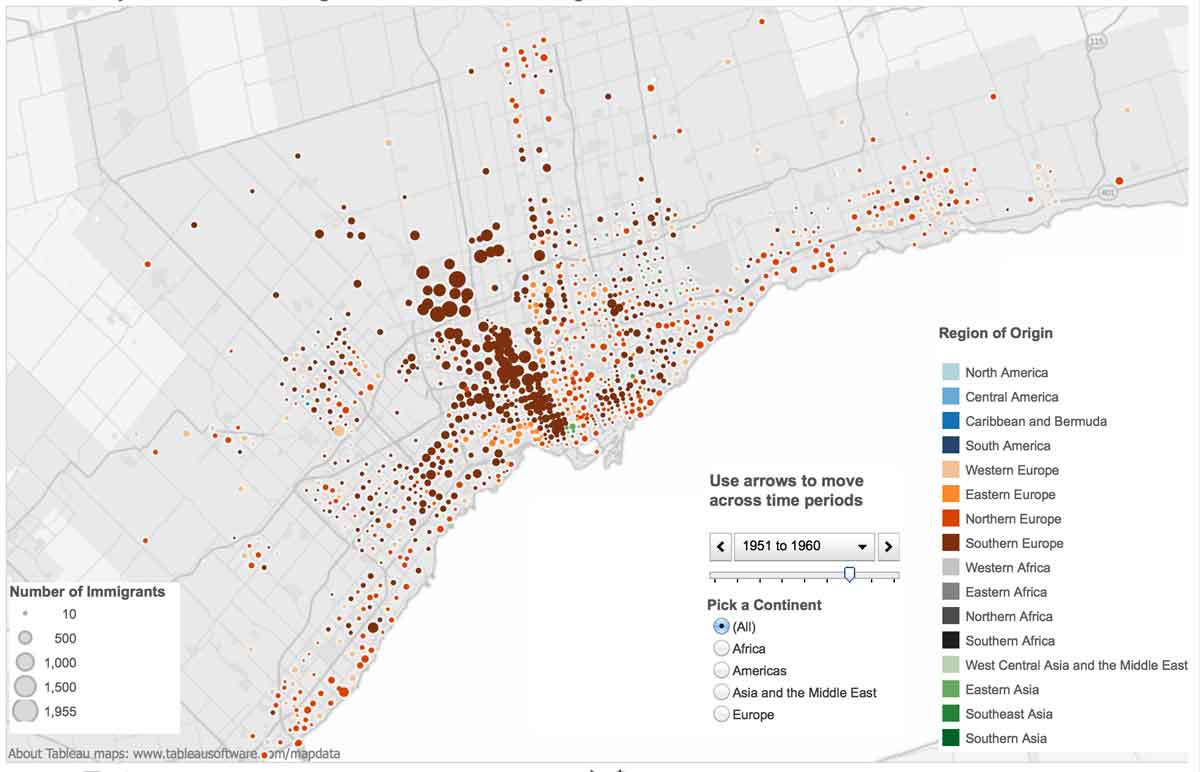
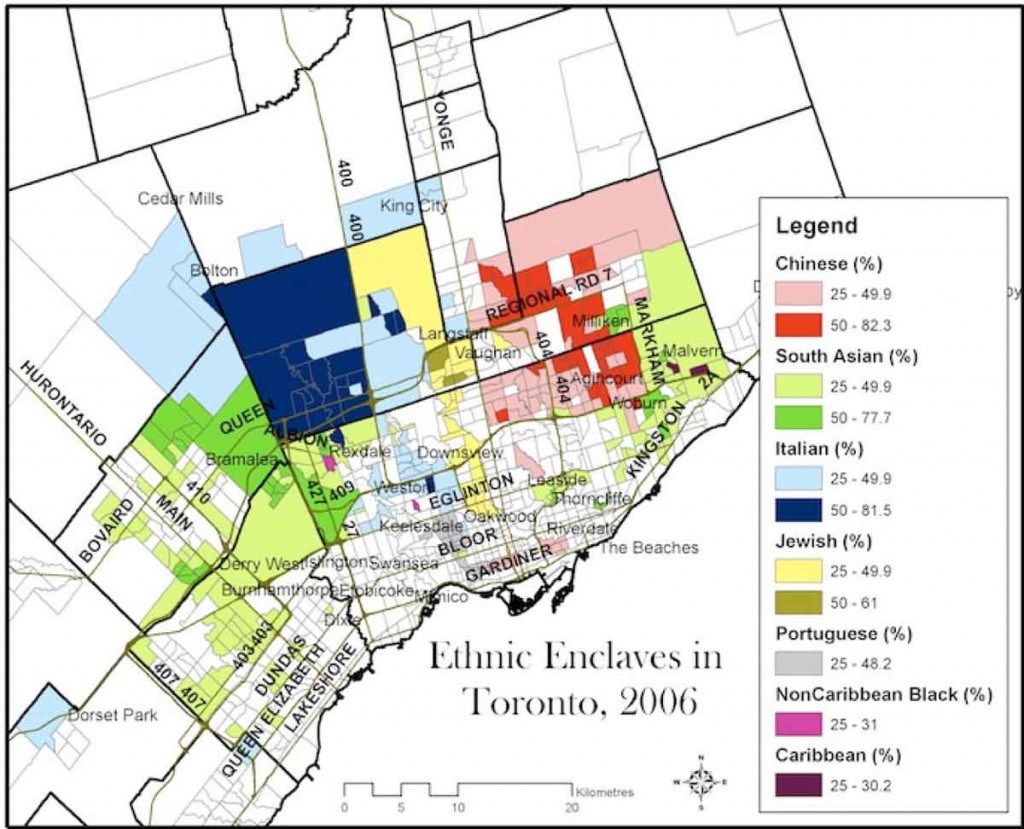
This map by Mohammad Qadeer of Queen’s University illustrates both the growth and the ethnic diversity of the outer suburbs.  Most of the strong colours are in the outer suburbs – a map of population change since the 1970s has the same pattern, as does a map of visible minorities. Some outer suburban growth has been because of groups moving out of the City – most obviously the Italian and Jewish populations shown here, but many immigrants now go directly to the outer suburbs. In either case, the post-1970 outer suburbs have a population that is no less diverse than that of the City, and in in the north-west and north-east the proportions of foreign born residents are well over 60%.  Overall the resident of the Toronto metropolitan area are about 50% foreign born, the highest proportion of any metro area in North America (or Europe), and the proportion of visible minorities is only a few points lower. Concentrations of the white populations are found in a corridor adjacent to Yonge Street north to the border of the old City and in the south west part of the new City; otherwise beyond the outer suburbs shown in this map diversity tends to decline with distance from the City of Toronto.

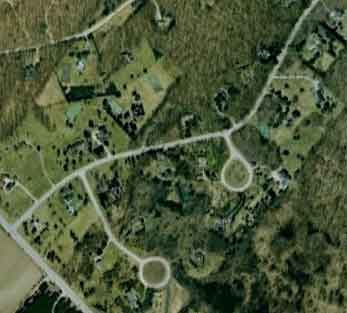
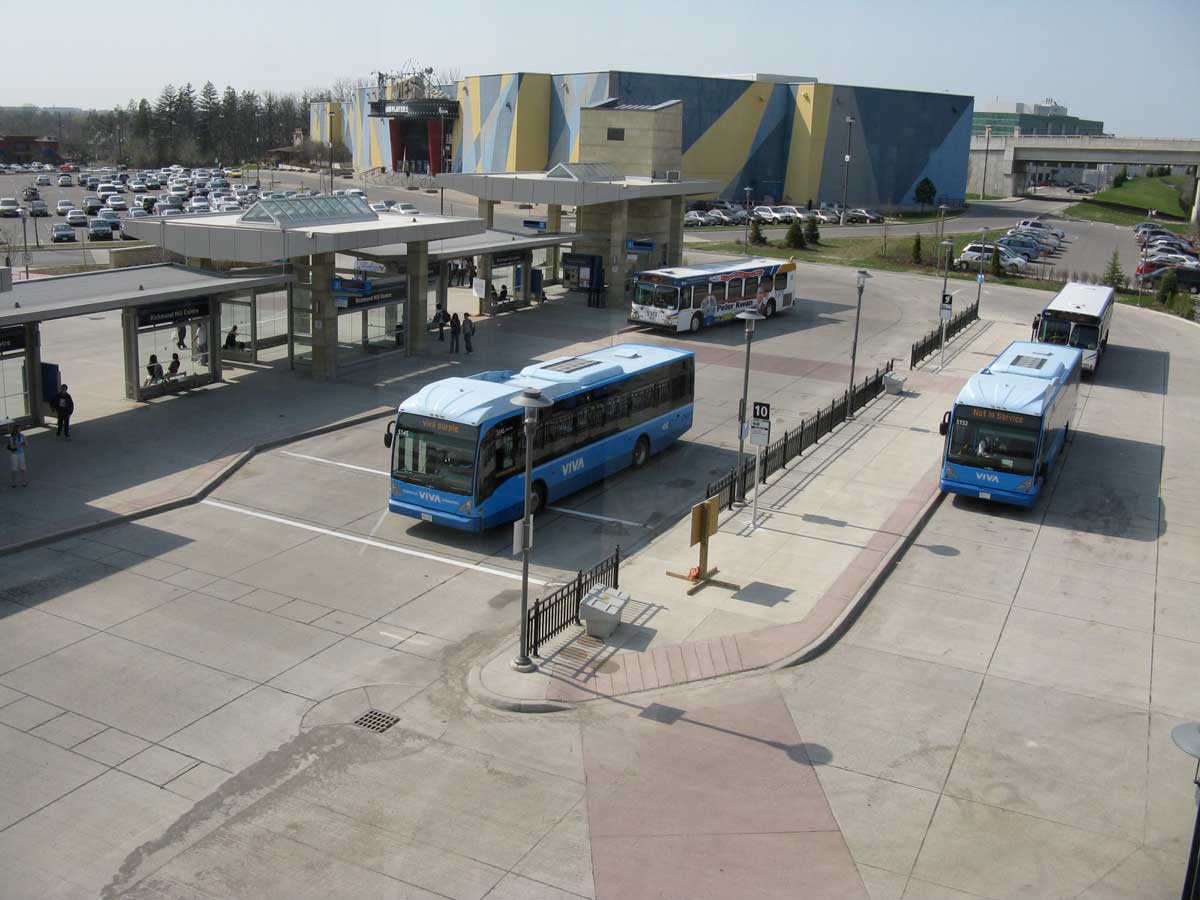
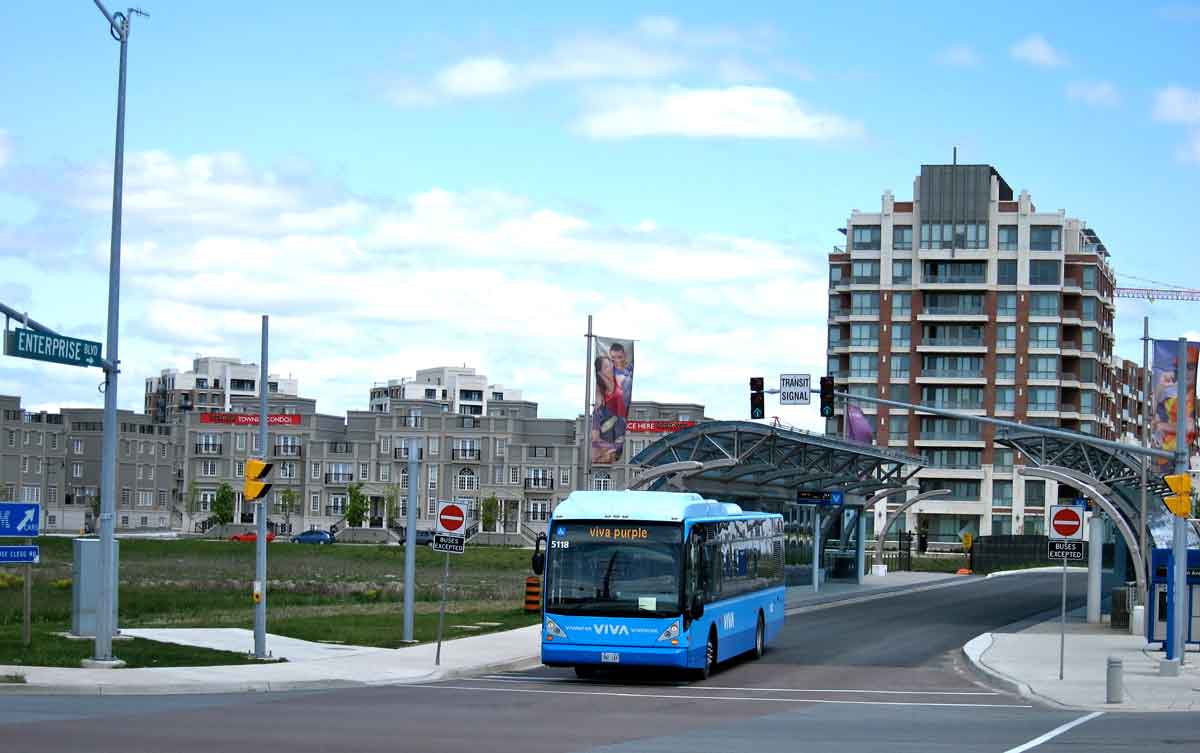
Ethnic diversity is reinforced by a diversity of suburban forms. The outer suburbs are structured around about thirty distinctive centres, some of them former villages that have become local tourist attractions, but several of them major suburban downtowns. These are edge cities except that they are not on the edge but in the centre of their municipalities, have concentrations of civic amenities such as city halls, and are rigorously planned.

4g.MarilynMonroe-web-2 4gCentralMississ-web

4mBarmptondowntown-web 4g.DowntownMarkhamViva-web-2

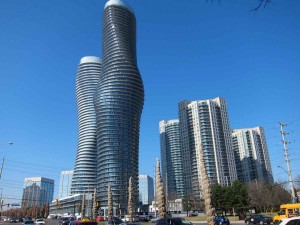
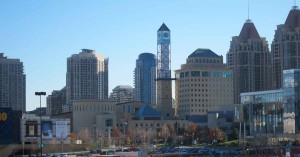
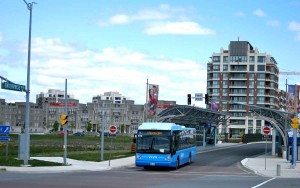
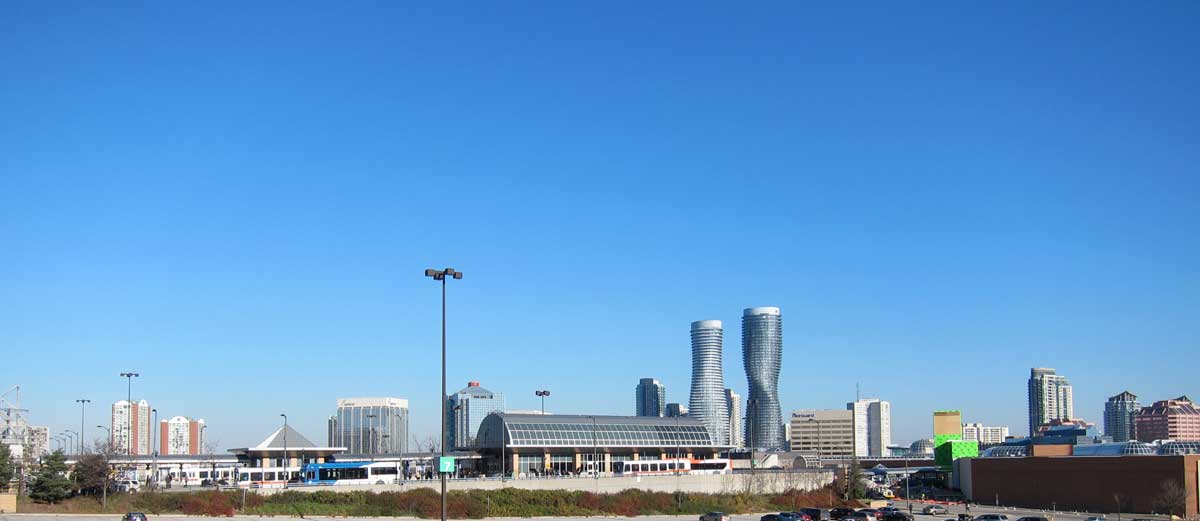
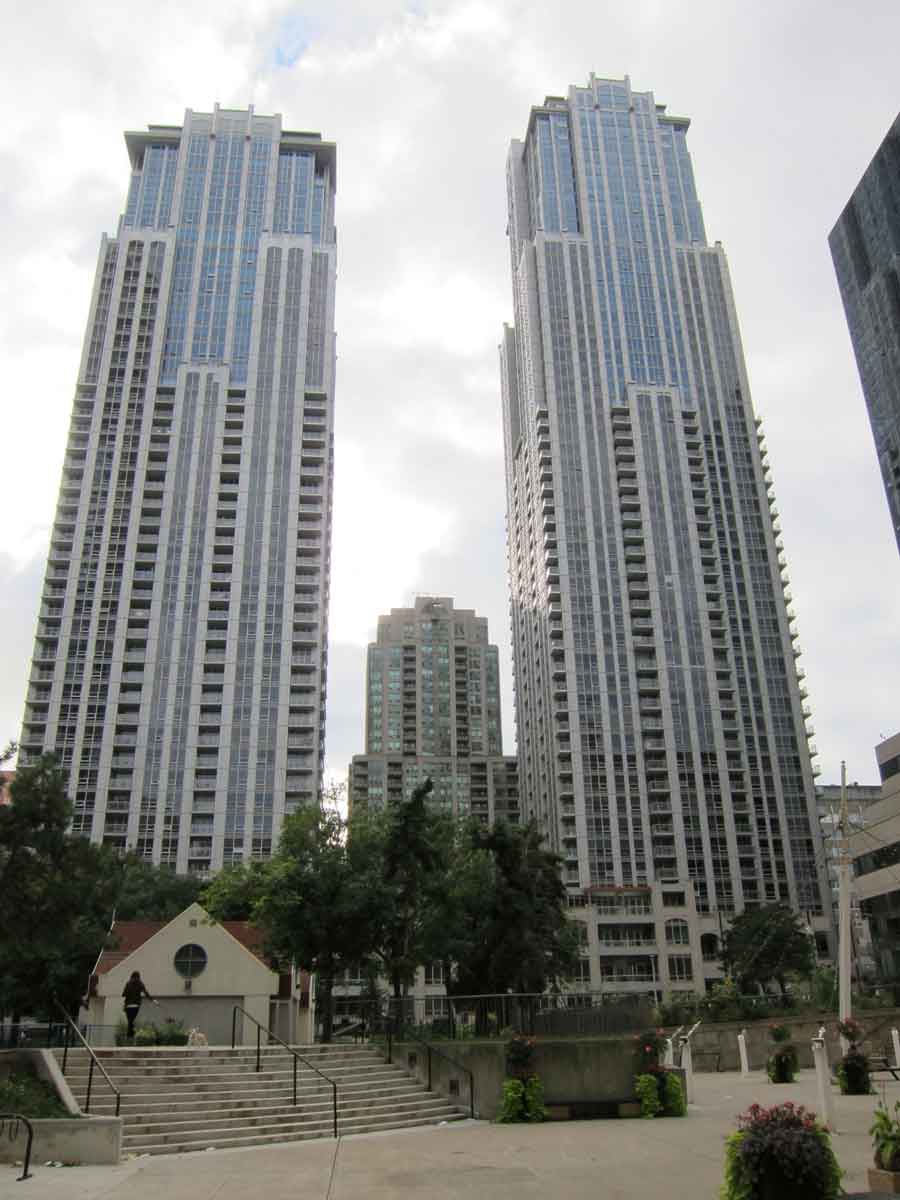
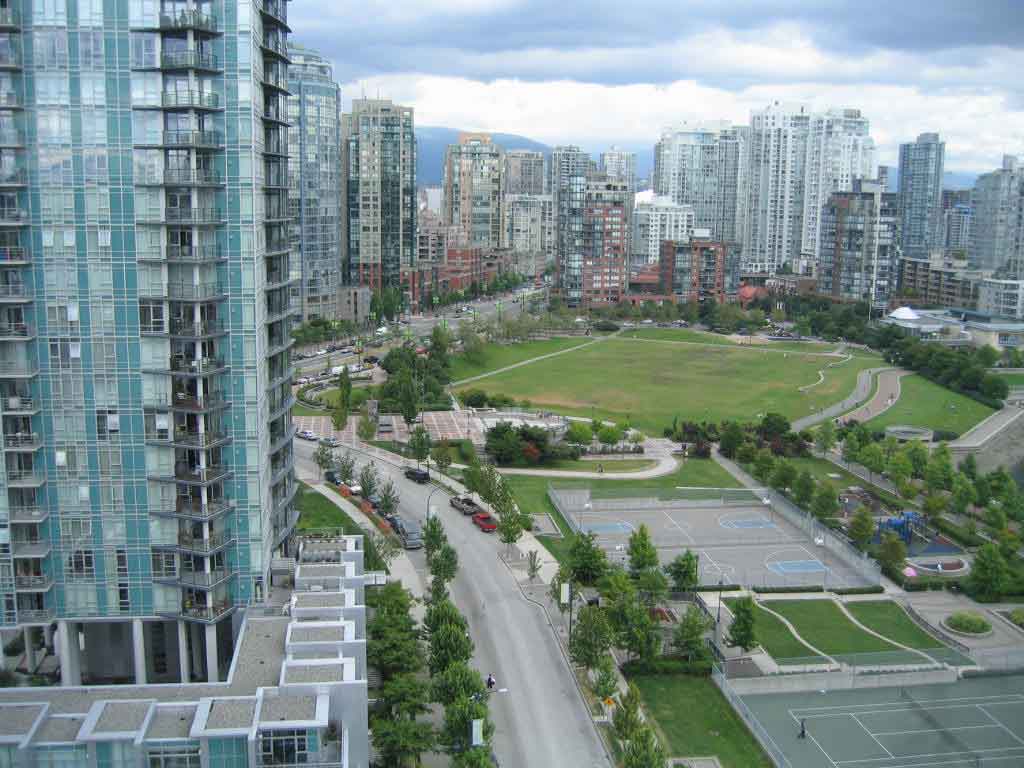
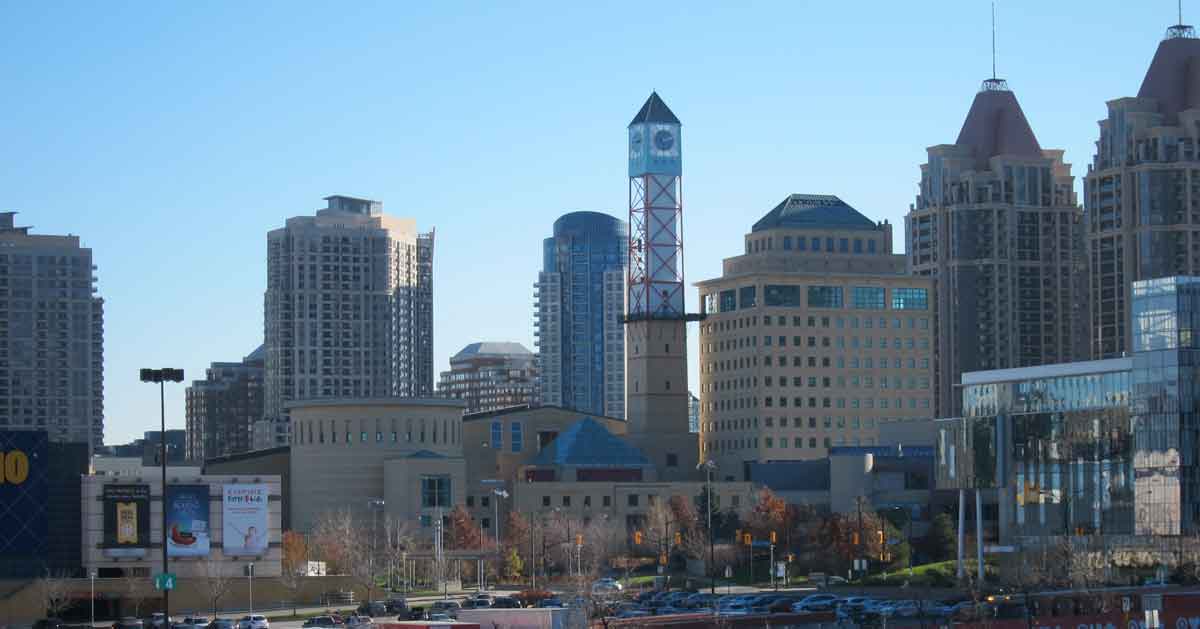
Top left are the Absolute Condominiums, nicknamed the Marilyn Monroe towers, in part of Mississauga downtown – they were voted the best skyscrapers in the world for 2012 by the German firm Emporis.com. Top right is the downtown core of Mississauga – the building with the clock tower is the Civic Centre, the towers are mostly condominiums. Bottom left is downtown Brampton, a late-19th century small town being redeveloped as the core of the municipality. Bottom right is downtown Markham, a new urbanist, greenfield development still under construction, with a bus rapid transit system running on a dedicated right-of-way.

4g.Bramptonedge-web
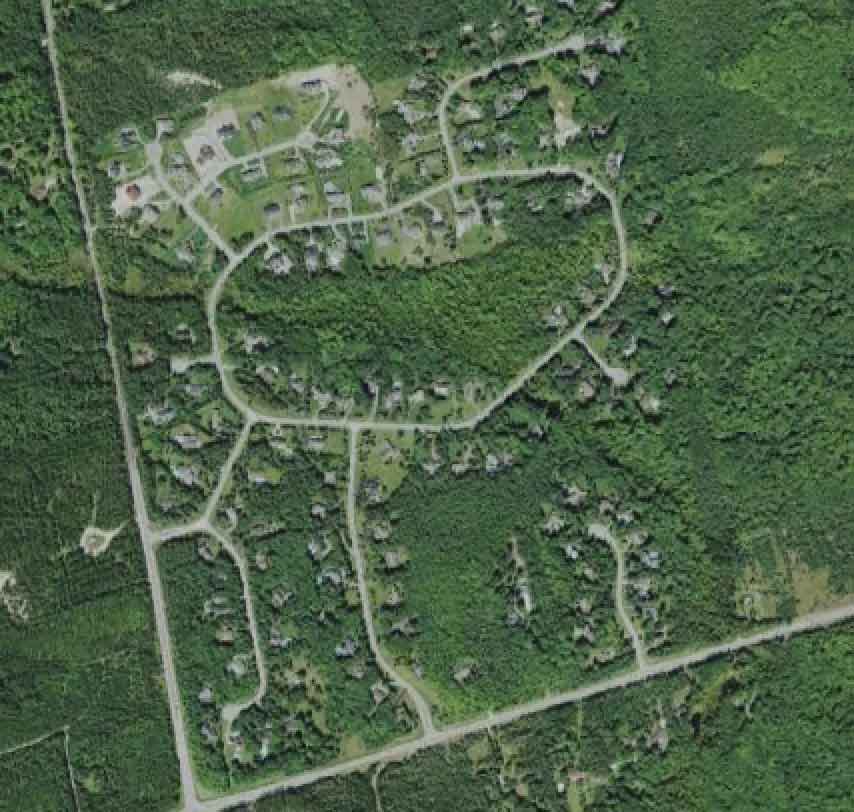
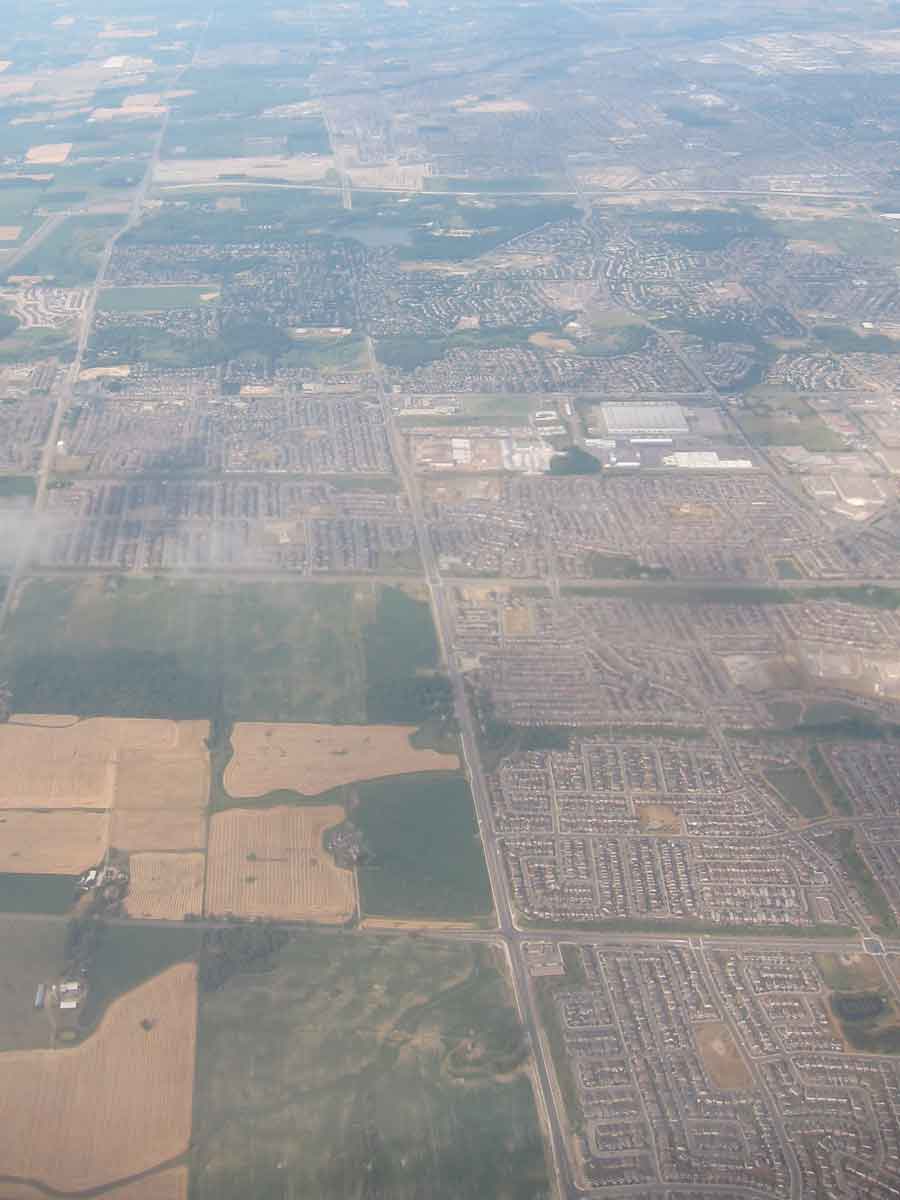
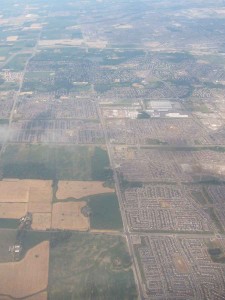
Between the various centres are patches of residential development, (and employment districts and other uses), many of them with modest houses on small lots, that reach to a precise but temporary urban growth boundary. This photo shows the western edge of Brampton. This sort of clean edge was used by Metro, keeping the provision of services and development in tight lockstep.  When needed, the edge is extended by another band of the megagrid, which can be seen here outlined by arterial roads.

The overall density of the metropolitan area of Toronto is about 7000 people per square mile, roughly equivalent to Copenhagen or Stockholm. In North America Los Angeles is close to this, Chicago and Portland are about half.

Regional Plans

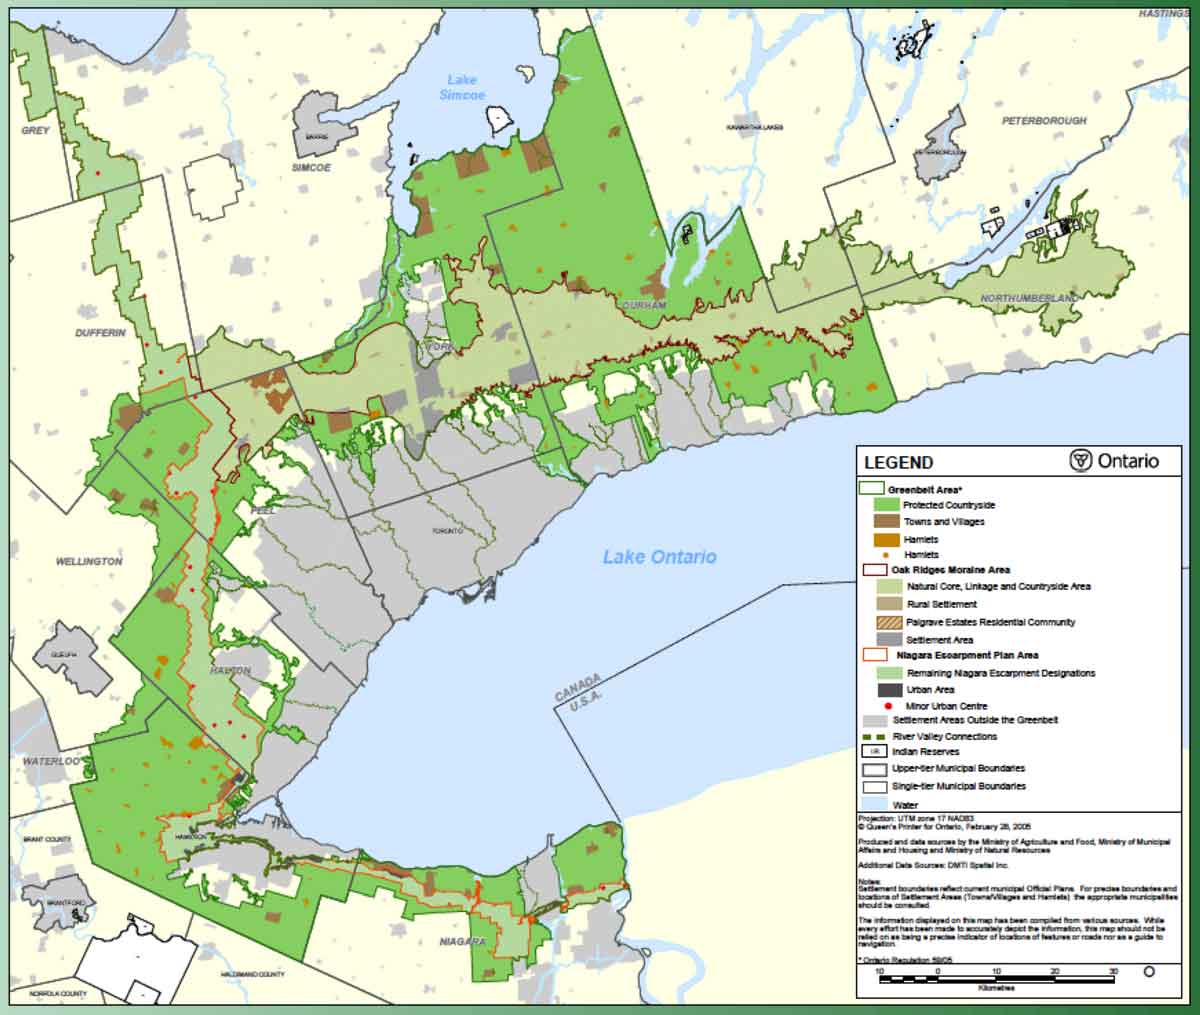
My sixth and final set of comments is about regional plans.  Growth of the sort shown in the photo above has been relentlessly pushing outwards for the last 30 years as the regional population has grown between 80,000 and 100,000 per year.  In the 1990s the province was alerted to the fact that this beginning to impinge on the environmentally sensitive areas of the Niagara Escarpment and the Oak Ridges Moraine, respectively to the west and north of the metro area. After a decade of discussions and proposals, in 2006 the province passed legislation implemented three regional plans that will govern urban growth for the foreseeable future.

5GreenbeltPlan-web
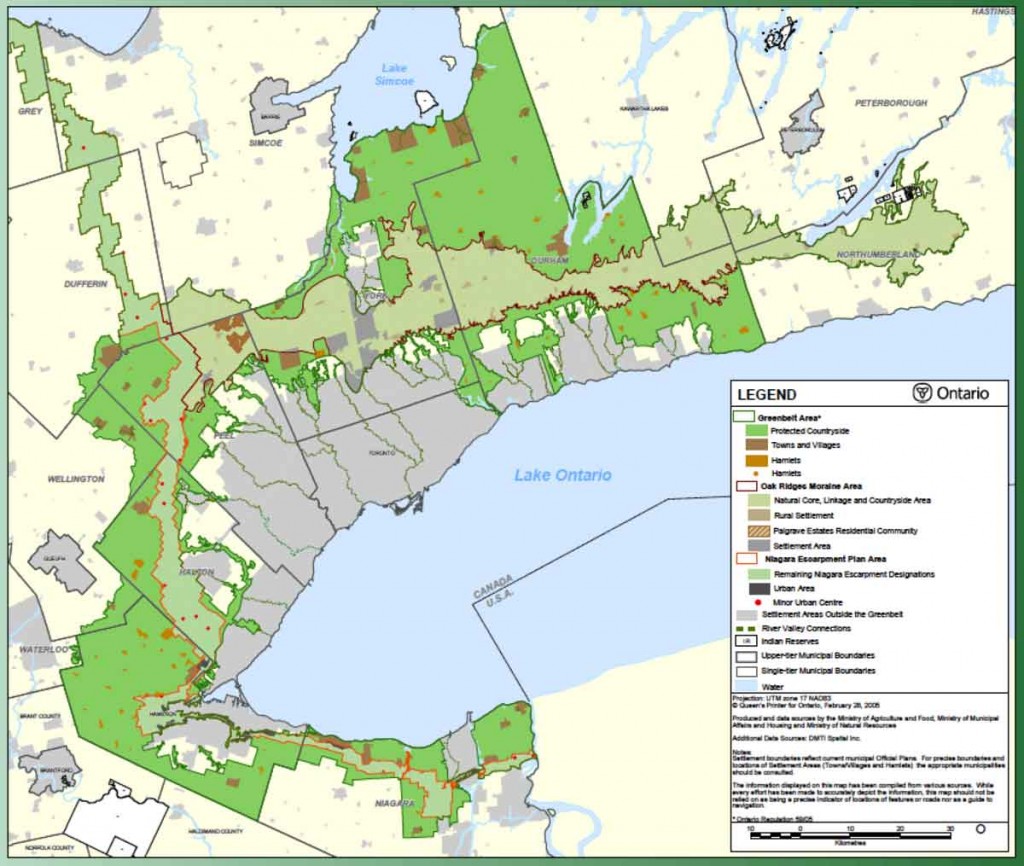
The first was the Greenbelt Plan, which identifies those environmentally sensitive areas and some adjacent ones as “areas where urbanization shall not occur.” It effectively wraps a corset of green around the metropolitan area.

Nevertheless, population and urban growth asa result of immigration will continue. So the second plan, The Growth Pl an, identifies targets for intensification everywhere, specifies 25 urban growth centres for especially high levels of intensification, and extends the planning region beyond the greenbelt to an area that extends from Lake Huron to Niagara Falls.

5GrowthPlansTransit-web

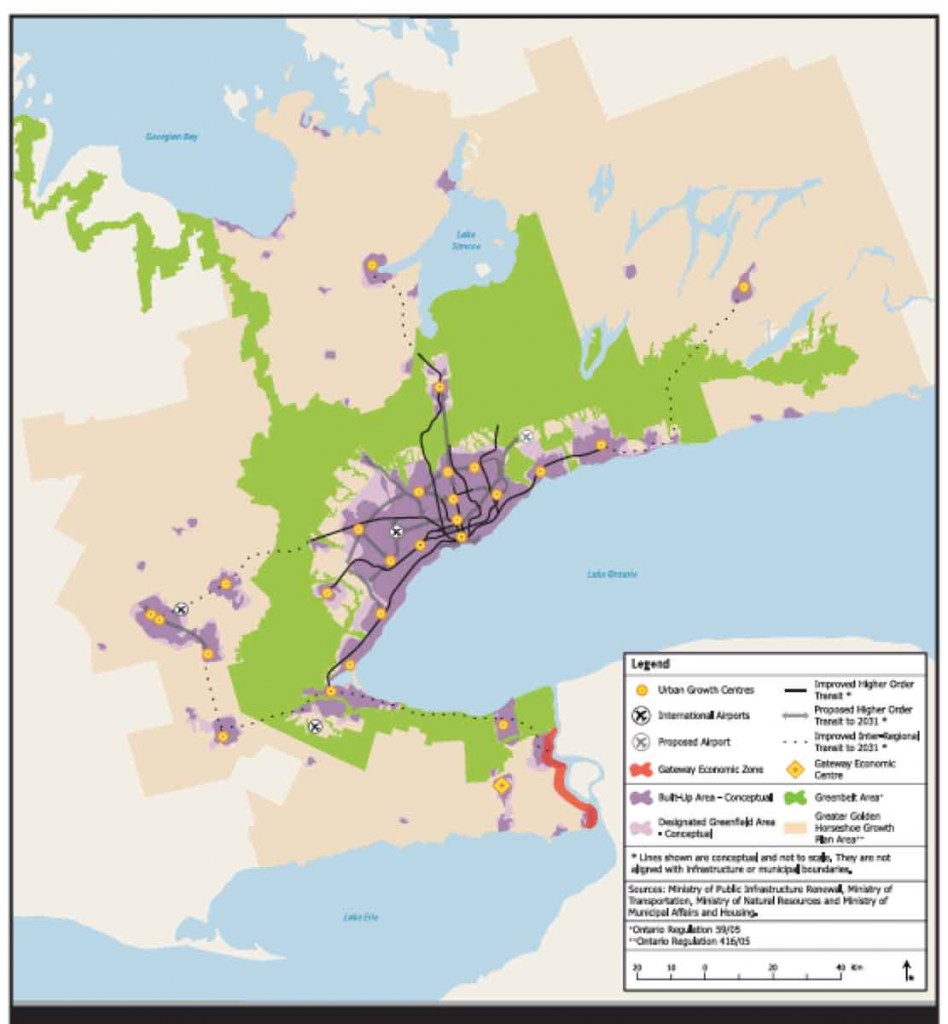
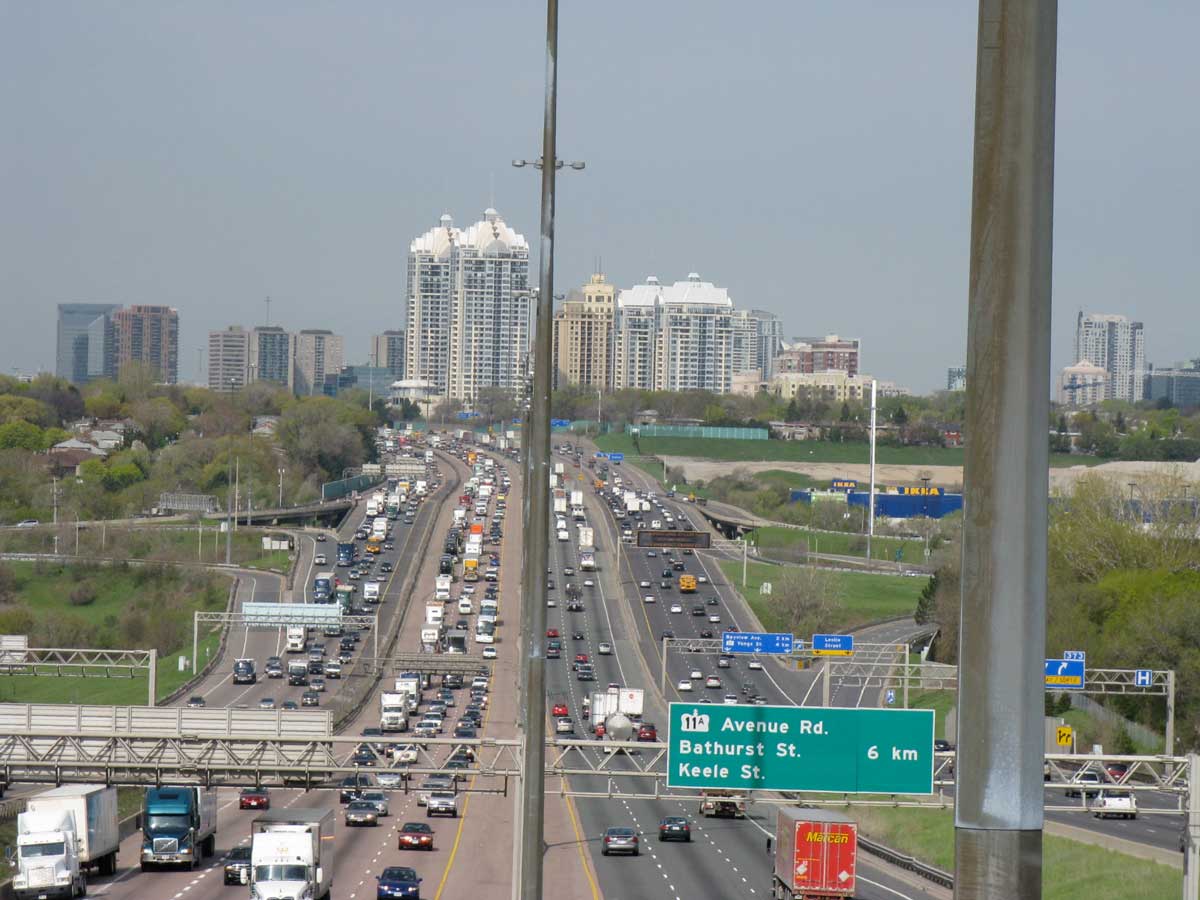
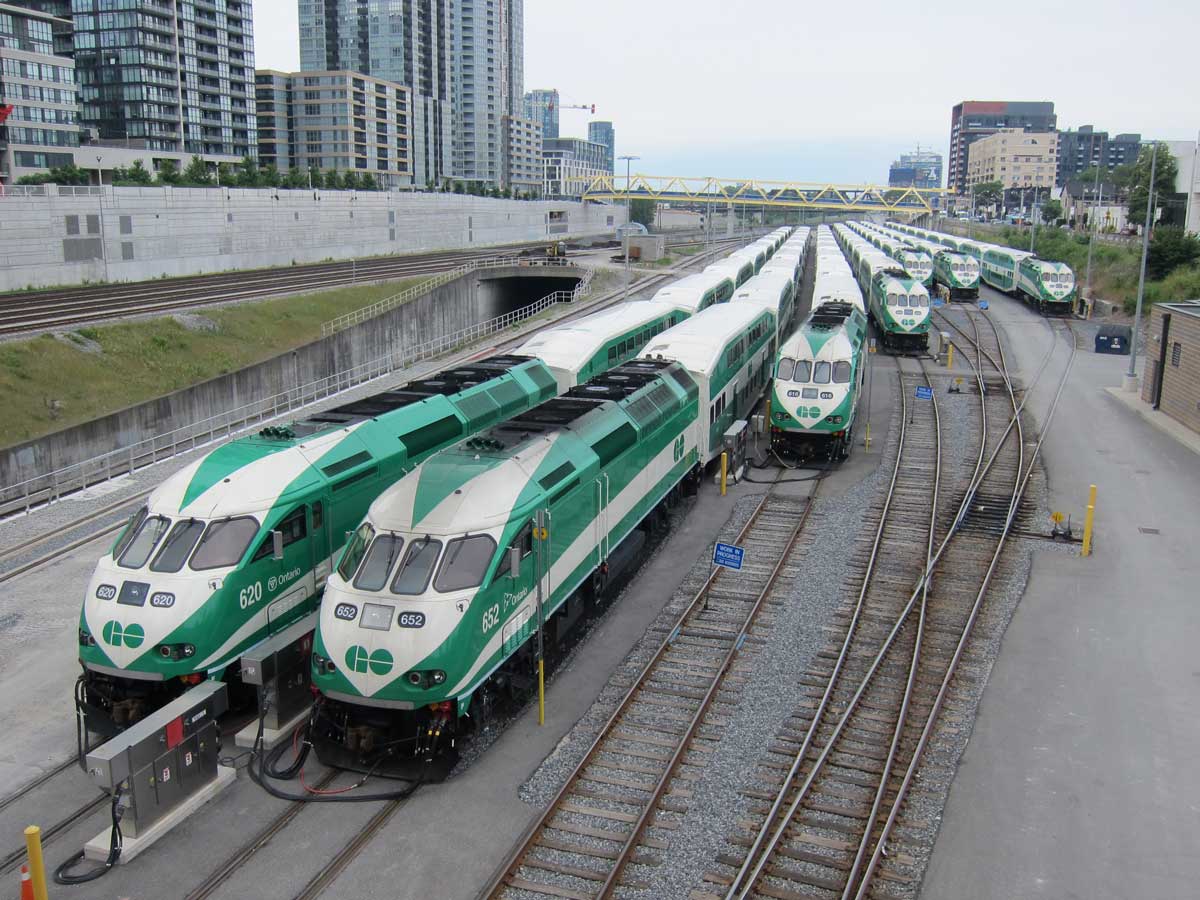
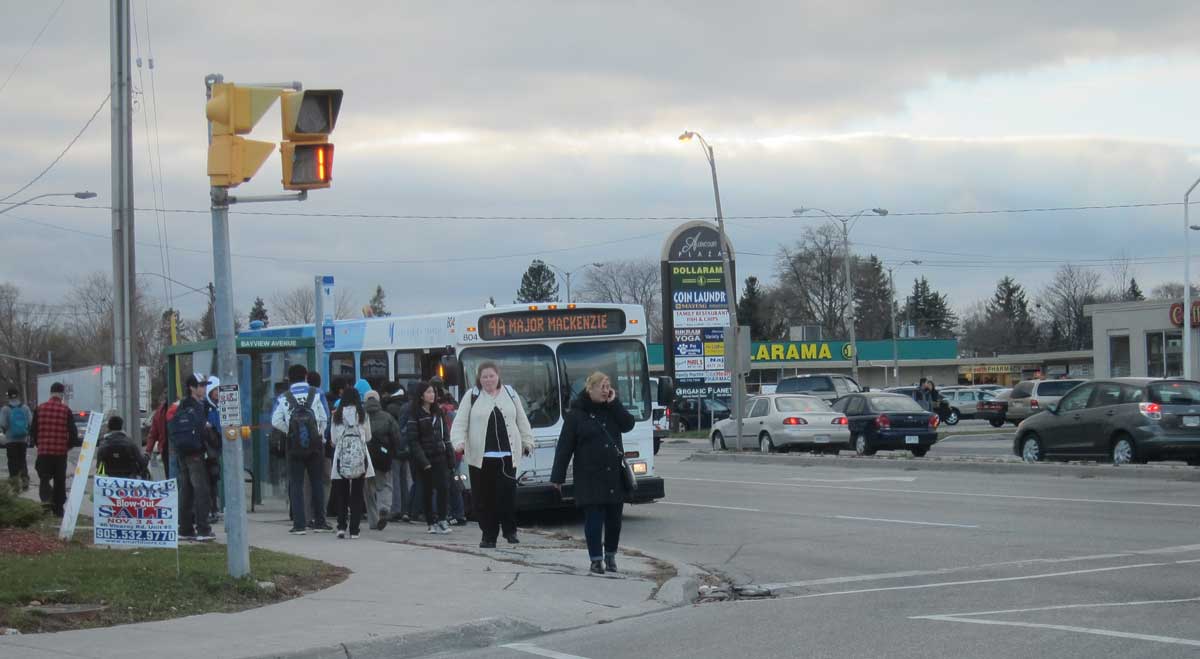
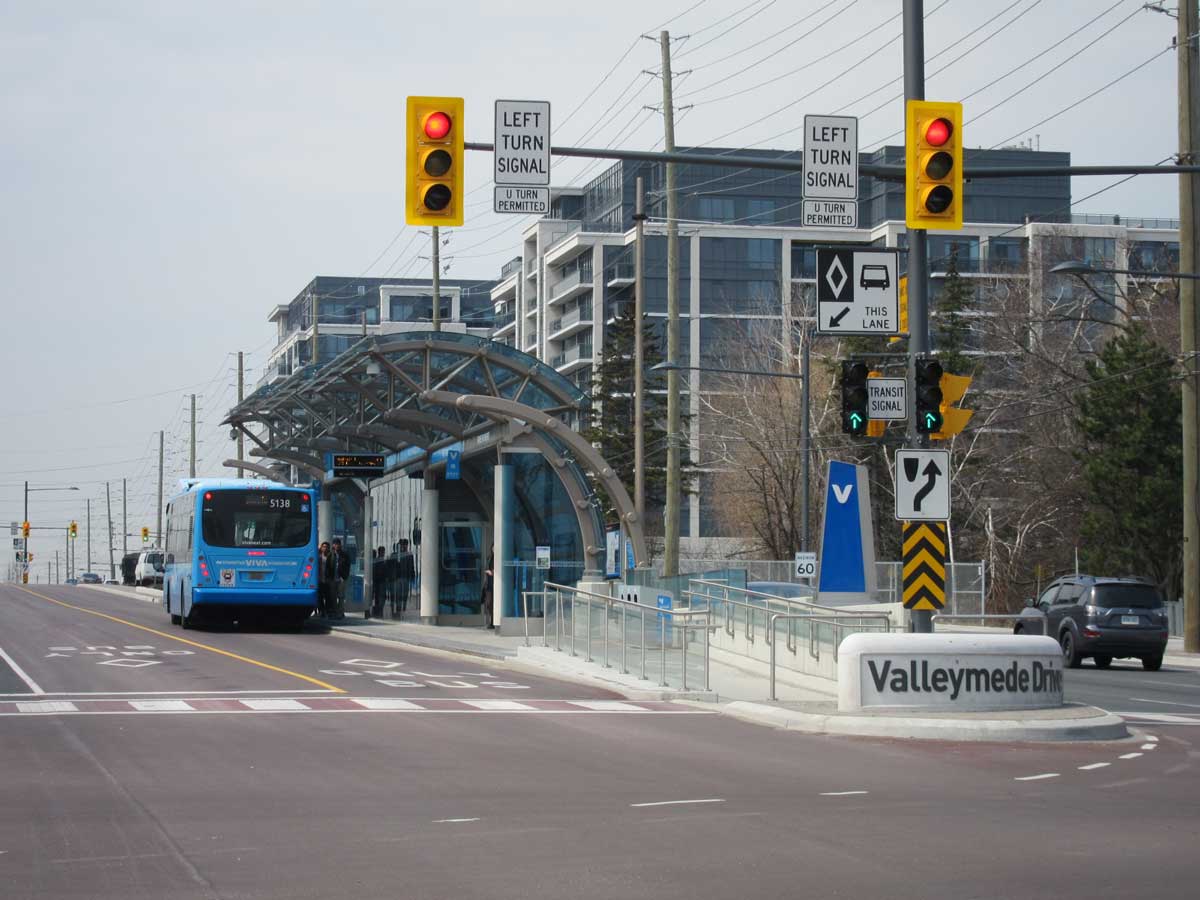
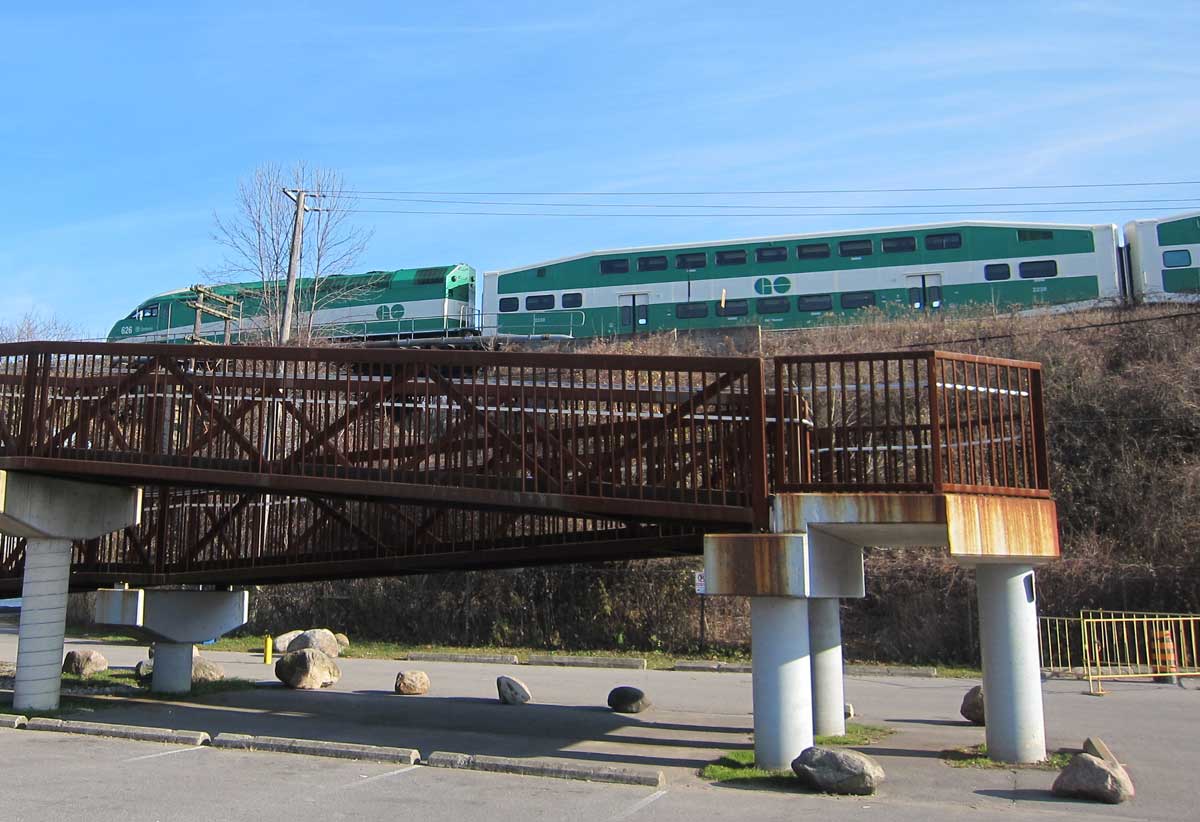
The third plan, called The Big Move, is for transportation planning, especially transit.  The map above, though it is from the Growth Plan shows part of what the Big Move proposes – improved higher order transit along regional rail routes. At a more detailed level, the Big Move also emphasizes the role of light rail.  There is to be very little new investment in roads and expressways. The idea, of course, is that with intensification transit will become more viable, and the more transit will promote intensification.

It is intriguing that after about 70 years of intense planning, the apparent model for future development and redevelopment throughout the region seems to be the sort of transit-supportive urban form that was created in the essentially unplanned industrial old City of Toronto.

Concluding Remarks

A question posed by the organizers of the conference in order to direct my presentation was – in what sense is Toronto an American city? In terms of planning I think Toronto has generally tended to head off in opposite directions to US cities – for the first 150 years by scarcely planning anything, and in the last 70 years through increasingly comprehensive municipal and now regional planning. One consequence, especially obvious in the high rise apartments throughout the metropolitan area, is that overall densities are substantially higher than most American cities. In spite of these differences there is no question that many of Toronto’s urban landscapes have a strong family resemblance to those in the U.S. – a testament perhaps to the fact that the power of international trends in making urban landscapes can mask considerable local differences in planning, and also support for the astute observation of Torontonian Marshall McLuhan that every city is now a suburb of every other city.